Long & short windows
Identify recurring periods where a calendar spread historically tended to rise or fall.
Explore seasonal calendar spreads, compare contract months and validate long or short windows with transparent historical statistics.

Seasonality helps reveal windows where the relationship between two delivery months has repeatedly strengthened or weakened.
Identify recurring periods where a calendar spread historically tended to rise or fall.
Compare winning seasons, average movement and hypothetical profit for each window.
Select any part of the annual chart and recalculate the statistics instantly.
Search historical data for stronger entry and exit dates without hiding the evidence.

The dashboard combines a full-year seasonal path with detailed statistics for any range you choose.
Rank opportunities by direction, timing, consistency, average move and historical profit.
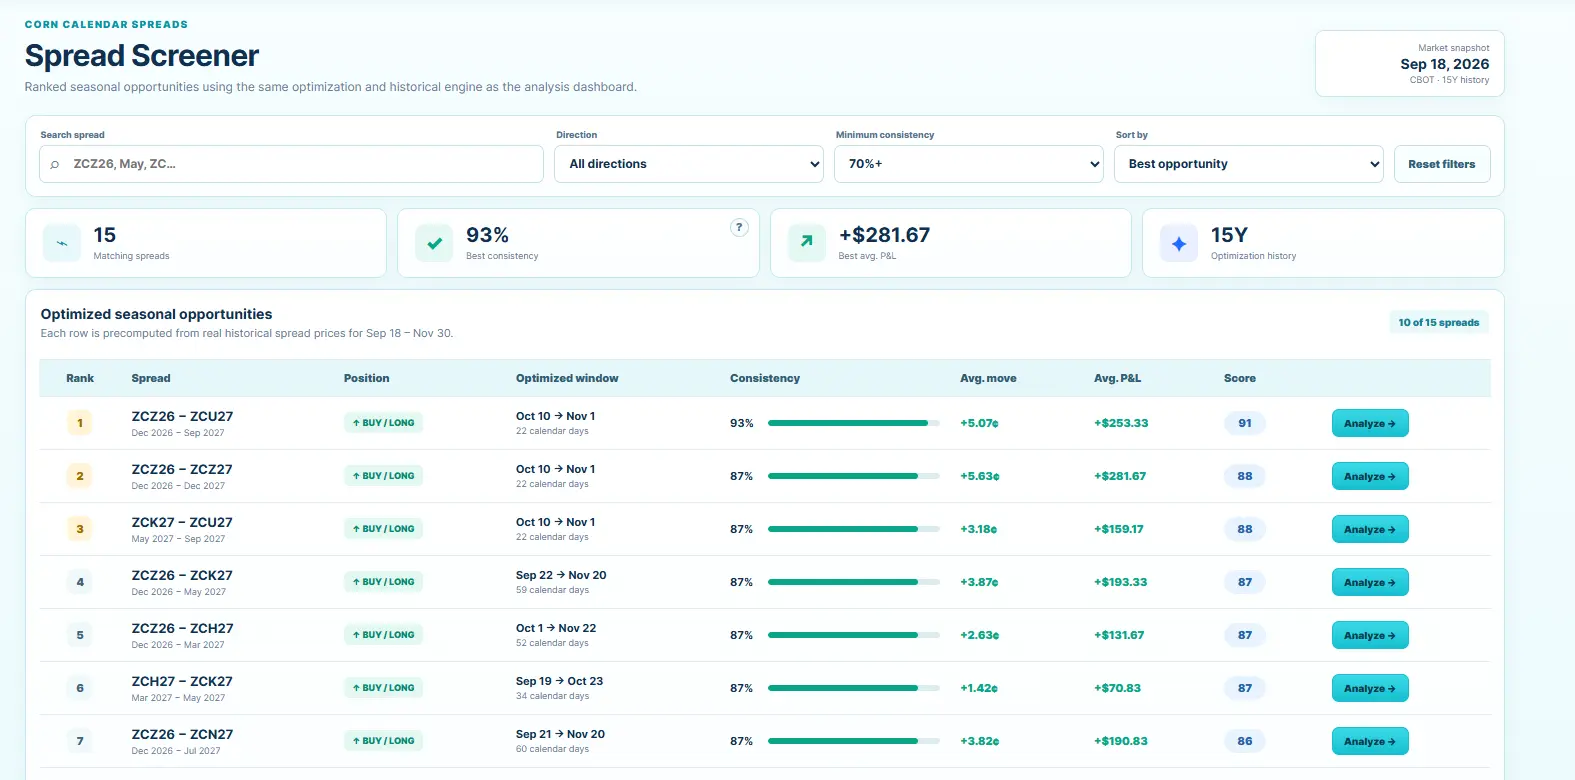
FuturesSpread keeps the process visible, so every statistic can be checked against the historical seasons behind it.
Select the front and back delivery months that create the calendar spread.
Align equivalent seasonal dates across as many as 25 previous years.
Drag the chart or use optimization to define entry and exit dates.
Review every year, wins, losses, average move and cumulative performance.
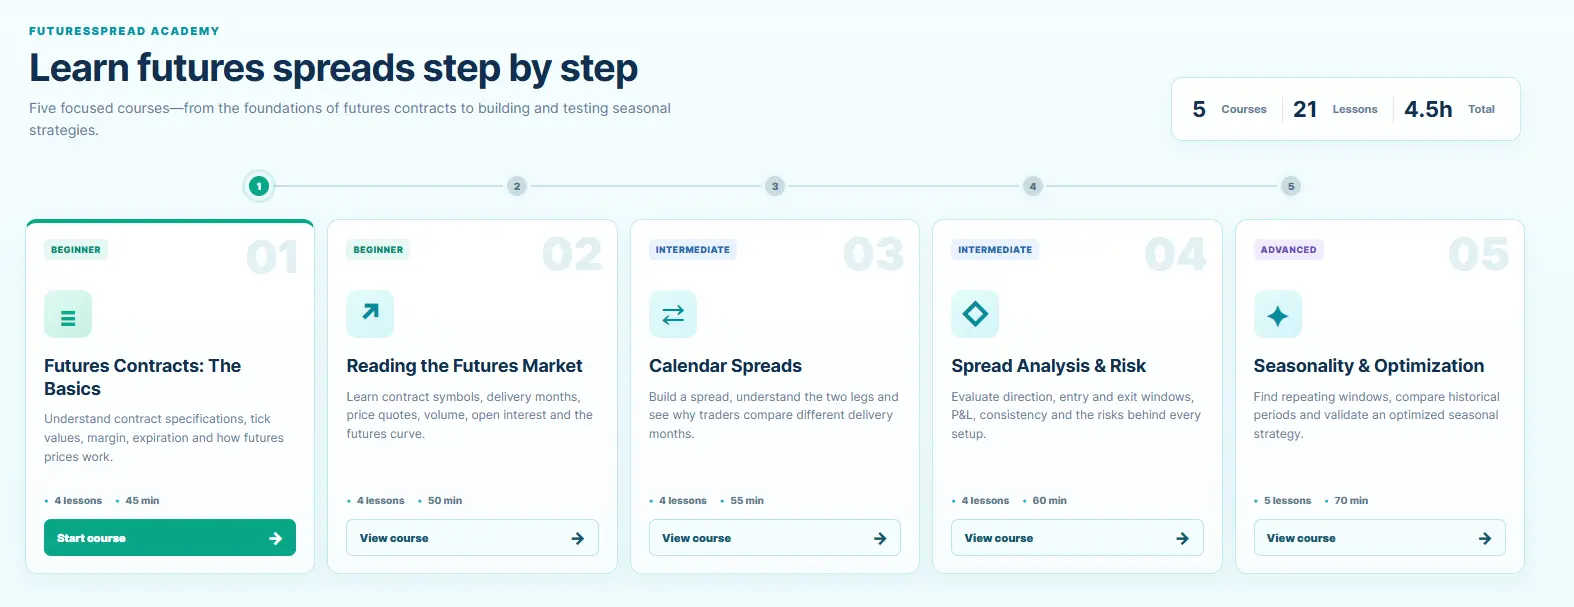
Build a solid foundation in futures contracts, calendar spreads, risk, seasonality and optimization through five focused courses.
Every headline statistic is backed by the individual historical trades used to calculate it.
Learn Calendar Spreads →Inspect entry, exit, movement and P&L for every season.
Compare recent behavior with longer-term seasonal structure.
Use patterns as research evidence—not as a guarantee or automatic signal.
Choose monthly flexibility or save with annual billing.
Billed monthly. Cancel anytime.
$24.17/month. Two months free.
Open the live dashboard and analyze a calendar spread in seconds.
Start Analyzing →