Production cycles
Planting, harvest, maintenance and other recurring events can affect delivery months differently.
Seasonal spread trading studies whether the relationship between two futures delivery months has shown recurring behavior at similar times of year.
Seasonal spread trading starts with a simple question: has the same calendar spread tended to strengthen or weaken during a similar part of the year across multiple historical seasons?

Planting, harvest, maintenance and other recurring events can affect delivery months differently.
Storage and stock levels can create recurring pressure on nearby versus deferred contracts.
Heating, driving, export and industrial demand can change through the calendar.
A seasonal average can summarize the historical path, but it should never be treated as a promise. The individual years behind that average matter more than the smooth line itself.
Choose the exact spread, define the dates and compare multiple history windows with the individual seasons behind the average.
Analyze Seasonal BehaviorA December–May corn spread is not interchangeable with a generic continuous corn series. The relationship depends on the exact delivery months and crop year, so historical analysis should preserve dated-contract identity.
A 5-year sample may capture the latest market regime, while 15 or 25 years can show whether the pattern persisted through different cycles. The disagreement between lookbacks is useful evidence about stability.

Review the winning years, losing years, average move, worst adverse move and cumulative hypothetical performance. A pattern driven by only a few exceptional years is weaker than one that appears broadly across the sample.
Current curve structure matters. A historical pattern observed mostly in contango may behave differently when the market is sharply backwardated. Use seasonality and the forward curve together.
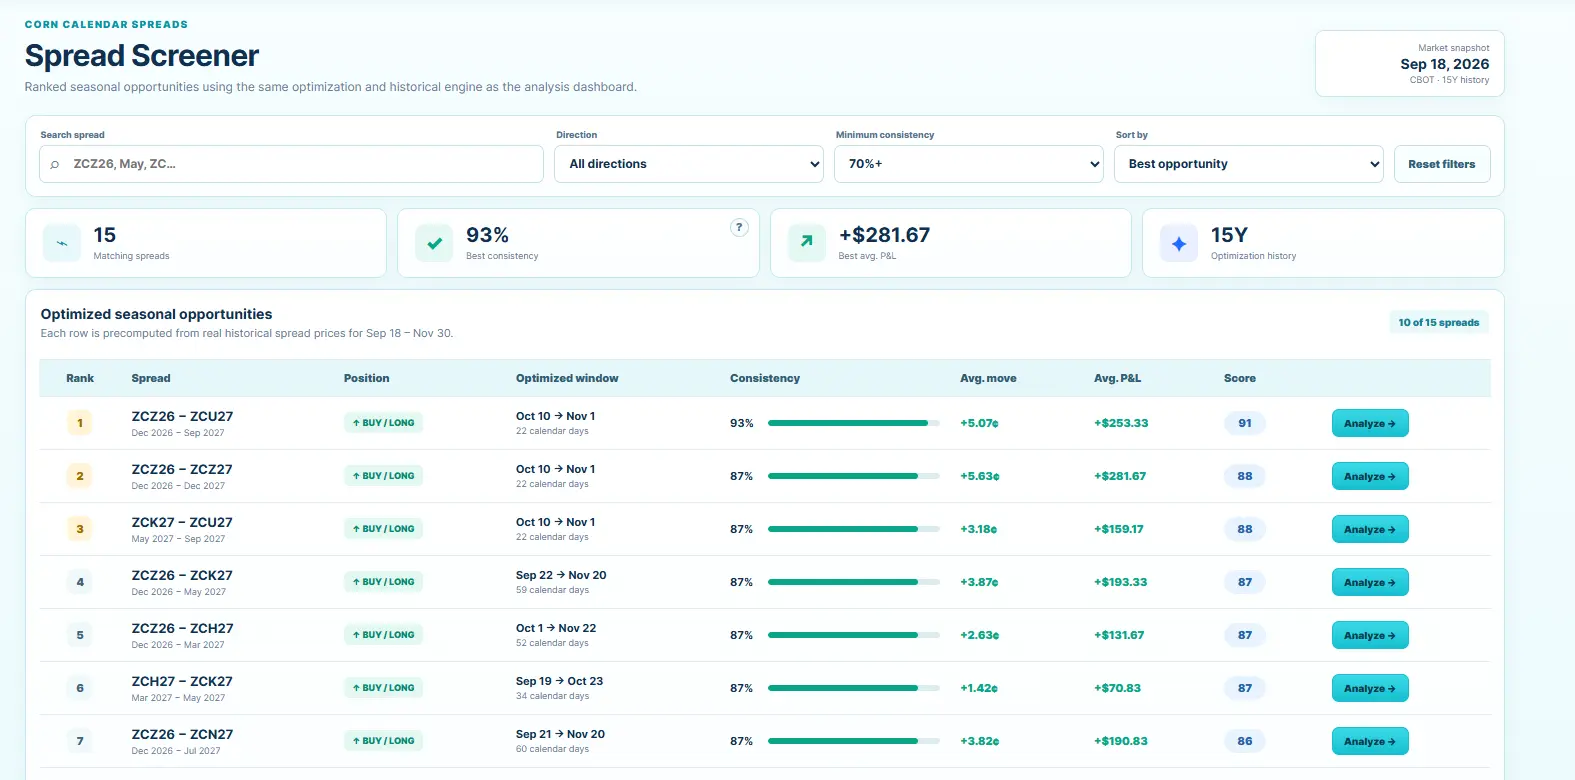
A useful seasonal pattern should not depend on one unusually strong year or one perfectly chosen date range. Compare the same direction across several historical windows, then shift entry and exit dates slightly. A relationship that disappears after a tiny date change is less robust than one that survives reasonable variation.
Next compare the average path with the individual seasons. If a smooth average is created by a few extreme years, the visual can hide important risk.
| Question | What to inspect | Why it matters |
|---|---|---|
| Is direction stable? | 5Y, 10Y, 15Y and longer lookbacks | Tests regime dependence |
| Is the average representative? | Median and individual years | Reveals outliers |
| Is timing robust? | Nearby entry/exit dates | Reduces overfitting risk |
| Is current structure comparable? | Contango/backwardation | Adds market context |
Define the spread consistently, for example December minus May. Select the seasonal window, apply equivalent dates to prior crop years, and then review win rate, median move, worst losing seasons and whether one year dominates cumulative hypothetical P&L.
Finally compare today's December–May segment with the current Corn forward curve. If today's structure is far more contangoed or backwardated than most historical observations, the old seasonal pattern may be less comparable.
A stronger study is reproducible: exact contracts, fixed date window, visible historical sample and no hidden losing years. The goal is to understand the relationship, not manufacture the highest possible win rate.
That is why Futures Spread exposes the individual historical trades behind the headline metrics.
Futures seasonality is the study of recurring historical behavior at similar times of year. It describes past patterns and does not guarantee future performance.
Calendar spreads depend on exact delivery months. Using dated contracts preserves the specific relationship being tested instead of blending different expirations.
No. Longer history adds sample size, while shorter windows may better reflect recent structural changes. Comparing several windows is usually more informative.
Only after checking the individual years, losing seasons, dispersion and whether a few outliers dominate the average.
Compare exact delivery months, recurring windows and every historical season behind the pattern.
Open Futures Spread AnalyzerFutures trading involves substantial risk. Historical seasonality is descriptive and does not guarantee future results. This material is for education and research only and is not investment advice.