A focused alternative for seasonal spread research
FuturesSpread is a browser-based research platform for traders who want to move from an exact futures contract pair to seasonal charts and individual historical outcomes. If you are considering a SeasonAlgo alternative, start with the research you actually repeat: select a market, inspect the delivery months, compare lookback windows and review losing years before drawing a conclusion.
This page is published by FuturesSpread. It is a product comparison guide, not an independent customer review. SeasonAlgo is a separate service; we are not affiliated with or endorsed by it.
What to compare with SeasonAlgo
SeasonAlgo publicly describes seasonal patterns, spread backtesting, scanning, multi-leg structures and forward curves. Those features are also the right categories to evaluate when testing another platform. Compare the implementation and coverage you need, rather than assuming a feature is exclusive.
| Research need | FuturesSpread workflow | SeasonAlgo public description |
|---|---|---|
| Seasonal comparison | Select dated legs and compare historical lookbacks. | Seasonal patterns across several history lengths. |
| Historical outcomes | Inspect entry/exit windows and year-by-year results. | Spread backtesting and historical results. |
| Discovery | Open the spread screener, then inspect a candidate. | Strategy search and scanning tools. |
| Curve context | Inspect delivery-month relationships in the forward-curve view. | Forward curves and curve analysis. |
| Coverage and data | Check the current market list and available history in the app. | Check the provider’s current contracts and access terms. |
Source: SeasonAlgo platform description, reviewed September 29, 2026. Public descriptions are not a hands-on audit of every feature or subscription tier.
Try one complete research task
- Choose a spread you know. Write down both contract months, the season year and the subtraction order.
- Compare the same lookback. A five-year chart and a fifteen-year chart answer different questions.
- Inspect individual years. Look for missing seasons, unusually large moves and changes in the shape of the pattern.
- Define the window. Keep entry date, exit date and trade direction unchanged while comparing results.
- Review downside. Read losing outcomes and drawdowns alongside the headline win rate.
A useful comparison ends with an explanation of the result, not simply a preference for one chart’s appearance. If two platforms disagree, check contract mapping, price conventions, missing dates, normalization and costs before treating either result as wrong.
Evaluate speed through your own workflow
Try changing the contract pair, switching lookbacks and opening historical results. Note both the time to load and how quickly you can find the information needed for a decision. Repeat under the same connection and device conditions. We have not published a controlled head-to-head speed benchmark, so this page does not claim a measured speed advantage.
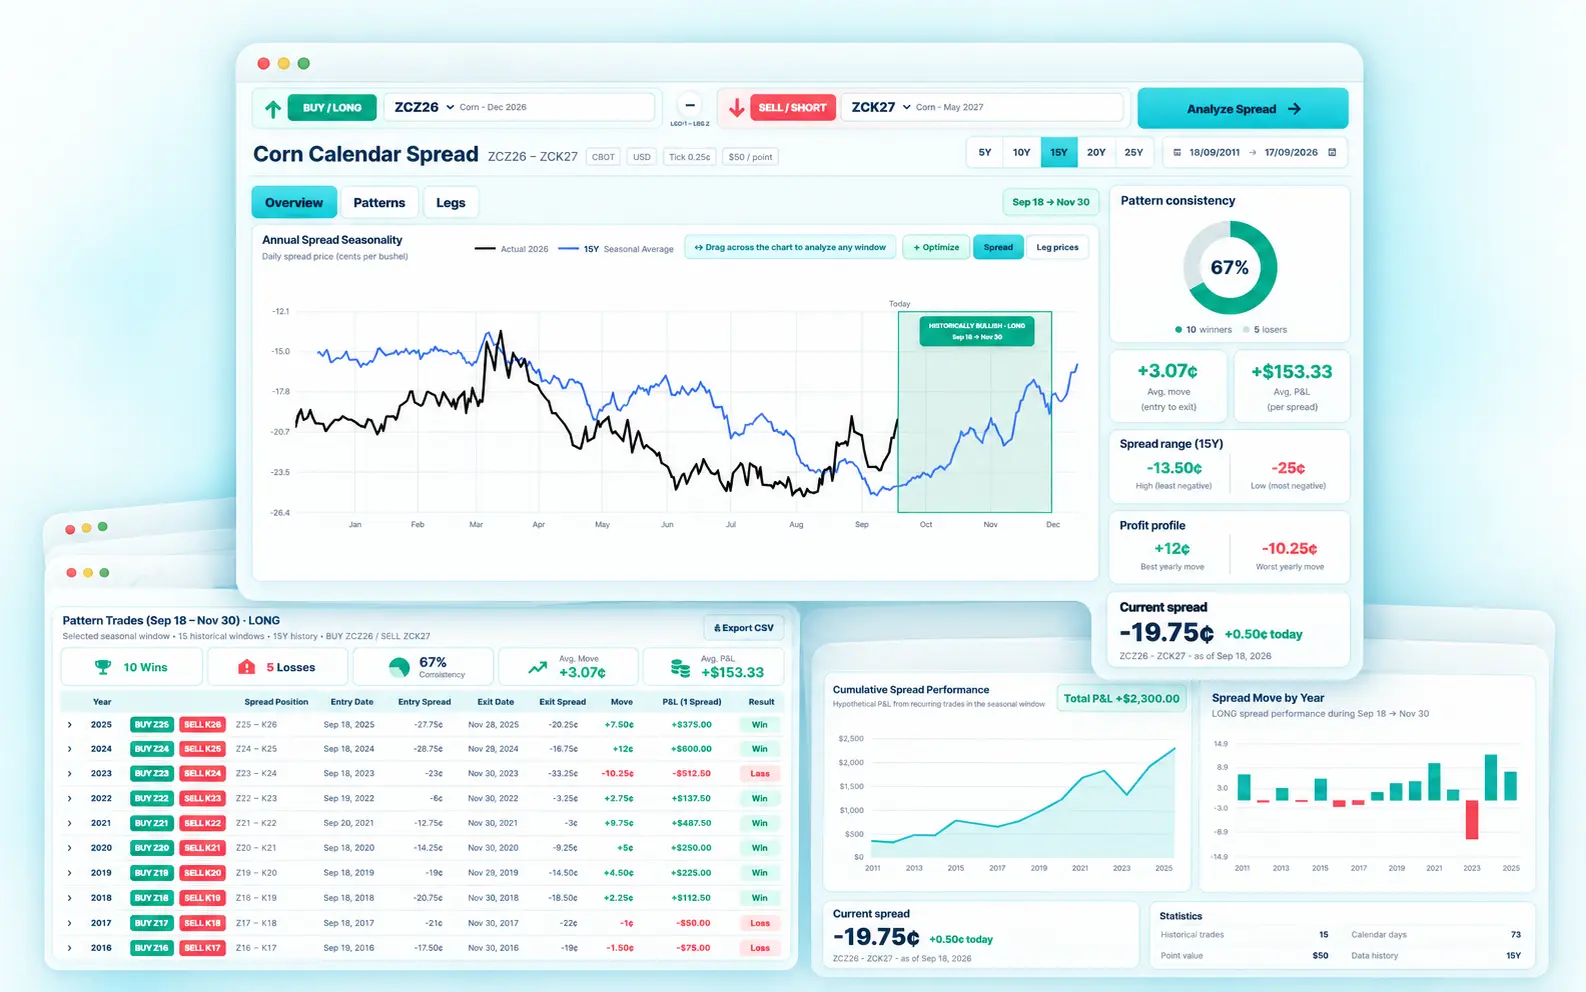
The screenshots on this page show the FuturesSpread interface. They illustrate the research layout, not a forecast or a promise that a past setup will repeat.
Check coverage, history and costs before switching
Confirm that your usual markets, delivery months and structures are available. The length of usable history depends on the contract pair; selecting a lookback does not guarantee a complete observation for every year. Check the latest date shown on the chart as well.
Use the current pricing and access terms of each provider when comparing cost. A lower subscription fee is not useful if a required market is missing. Likewise, a longer feature list may not matter if your daily research uses only a small part of it.
Can I transfer my SeasonAlgo portfolio?
This guide does not offer an automatic SeasonAlgo import. Recreate a small sample of your research manually using exact contract identifiers and verify the outputs before changing your established process.
Who should evaluate FuturesSpread?
An alternative is worth investigating when a recurring part of your research feels difficult: identifying the right contract year, moving between seasonal views, or tracing a headline result back to its individual observations. Start with that problem. A platform can look appealing in a demonstration yet leave your particular task unresolved. Your evaluation should finish with a concrete answer about a task you perform regularly.
For example, a grain spread researcher might need to compare July and December contracts across multiple seasons and distinguish the current contract pair from its historical equivalents. Someone researching complex energy baskets needs different coverage and ratio handling. Confirm those requirements first. The existence of an educational guide about a market on this website does not establish that the instrument is available in the application.
FuturesSpread is a candidate to evaluate through its dated-contract charts, seasonal views and historical research workflow. If your essential requirement concerns an alert, an export format, a particular market or account access, verify it directly in the current product. Treat an unverified requirement as an open question instead of assuming compatibility from a general feature description.
A worked comparison: explain the numbers before choosing
Consider an invented comparison of the same spread in two research systems. Both display ten historical seasons, but one reports eight profitable windows and the other reports seven. That disagreement is useful evidence to investigate. Write down which specific year differs, then inspect its entry and exit dates. A weekend adjustment or a missing observation can change a small gain into a small loss without indicating a broader calculation failure.
Next check the quoted spread direction. A July-minus-December chart and a December-minus-July chart are sign reversals. An increasing line benefits a long position in the first definition but describes a different position in the second. Keep the subtraction order and trading direction separate in your notes. Then compare prices using the same currency, units and settlement convention.
Finally, reconstruct one historical outcome. If the defined spread moves from minus twelve to minus seven quoted units, its change is positive five units. The monetary result requires the appropriate multiplier and position size. Commission and slippage assumptions belong in another explicit line. This small reconciliation exercise is more informative than deciding that the larger headline profit must represent the better platform.
Make a switching decision you can revisit
Create a short evaluation record with three columns: requirement, observed result and unresolved question. Include one familiar spread, one losing historical window and one example with limited history. The familiar example tests whether you can reproduce your routine. The losing example tests whether the interface supports critical review. The limited-history example tests whether reduced evidence remains visible.
Keep copies of the settings you used, subject to each service’s export options and terms. Record the review date because coverage, interfaces and subscription terms can change. If you decide to change tools, rebuild a small research watchlist first and compare its definitions carefully. A saved strategy name alone is insufficient: retain the months, direction, historical window and any exclusions.
The practical question is whether you can reach a well-supported research decision with fewer unresolved steps. An attractive interface matters when it makes the evidence easier to inspect. Speed matters when it reduces waiting during the tasks you repeat. Neither replaces a clear understanding of what was calculated. Use the platform evaluation checklist to document that decision and the data quality guide to investigate disagreements.
Continue your research
Inspect the evidence behind a spread idea
Explore the available markets, compare seasonal windows and review historical outcomes.
Open FuturesSpreadFutures trading involves substantial risk. Educational examples are hypothetical. Historical patterns and backtests do not guarantee future results. Check current market coverage and access terms in the product.
Research content version 2026.09.29.1