Start with the contract relationship
Futures spread trading software should preserve the relationship you intend to research. A calendar spread uses two delivery months of the same market; an intercommodity spread can combine different instruments and contract specifications. Your first check is the exact leg definition, not the color of the seasonal line.
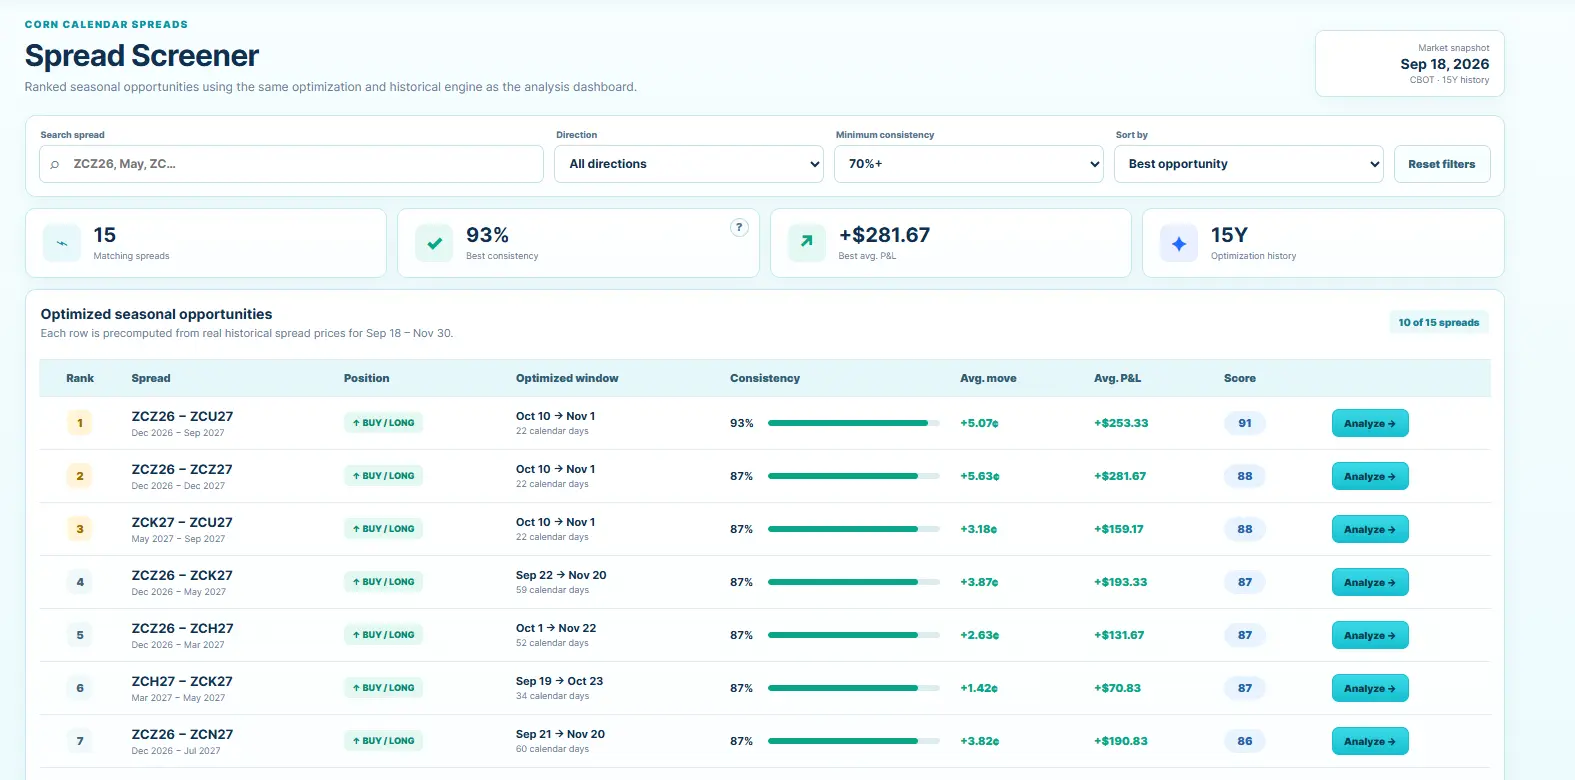
FuturesSpread connects dated-contract research with seasonal charts, a spread screener and historical results. Open the current app to confirm which markets and structures are available for your account.
Four views that answer different questions
| View | Question to answer |
|---|---|
| Spread chart | How has this particular relationship moved? |
| Seasonal comparison | Does the historical shape persist across lookbacks? |
| Historical results | What happened during a defined entry/exit window? |
| Forward curve | How are delivery months priced relative to one another? |
These views should challenge one another. A smooth average can coexist with several difficult years. A positive historical average does not explain whether today’s contract structure resembles the past.
From screener to a research decision
Use screening to shorten a list of candidates. Then open one candidate, check its legs and inspect the historical sample. Record your intended entry and exit dates before trying alternatives. Finally, examine downside and whether small date changes make the apparent advantage disappear.
For example, two windows can have the same win rate but different loss distributions. A window with frequent small gains and one large loss may have a poor average result. Software is most useful when you can see that distribution rather than relying on a single ranking.
Choose software for your workflow
Compare chart clarity, market coverage, history availability, result definitions and the effort needed to repeat a task. Keep a short list of essential functions and test each one with a real research example. Review prices and account restrictions on the live product before subscribing.
If you already use another seasonal platform, begin with the SeasonAlgo alternative guide and reproduce the same contract pair and historical window. Identical inputs make differences easier to investigate.
Distinguish research software from order execution
A spread research application helps you formulate and examine a relationship. An execution platform accepts orders and reports fills. These functions can be combined in some products, but you should never infer broker connectivity from the presence of a chart or a backtest. Before choosing software, write down whether you need analysis, execution, position monitoring or all three, and confirm each capability independently.
This distinction matters when translating an attractive historical window into an operational plan. A historical settlement series can support a comparison of past outcomes, but a settlement observation is not an order you could necessarily have filled at that price. Your broker’s available order types, contract permissions and deadlines are separate parts of the process. Record those outside the research chart so that a convenient workflow does not conceal an execution assumption.
Also distinguish a futures calendar spread from an options calendar spread and from a broker’s bid-ask spread. All three appear in searches for spread trading software. They require different models and inputs. For this guide, the central task is researching relationships between dated futures contracts, including recurring seasonal comparisons. That definition should remain visible in your evaluation notes.
Build a research record that survives a new session
Begin with a plain-language question, such as whether a particular delivery-month relationship has behaved consistently during a defined part of the year. Then record the two dated legs, subtraction order, unit convention and historical sample. A label like summer grain spread is too vague to reproduce. The details should let you reconstruct the same study without relying on memory or the default settings of an interface.
Keep a separate line for your hypothesis. You might be investigating a relationship between harvest timing and the relative value of two months. That economic explanation is distinct from the measured result. If the historical evidence contradicts the explanation, preserve the contradiction instead of silently changing the date window until the chart becomes attractive.
For each candidate, record a decision: investigate further, retain for monitoring or reject, together with the reason. A rejected study can be valuable because it prevents repeated work and documents why a promising average failed closer inspection. Whether you store these notes inside a platform or separately depends on the features available. The underlying requirement is a reproducible record.
Read a backtest beyond its win rate
Suppose a hypothetical ten-season study contains eight gains of one hundred dollars and two losses of six hundred dollars. Its win rate is eighty percent, but the total outcome is a loss of four hundred dollars before costs. This simple example shows why a ranking based on winning frequency can hide the most important part of the distribution. Inspect the size of the losses as well as their count.
Now consider the path between entry and exit. Two seasons can finish with identical gains while one experiences a much larger adverse move. End-to-end profit does not describe the funding pressure or the difficulty of holding the position. If software presents a drawdown metric, identify whether it describes one trade, an annual path or a cumulative strategy equity curve. These are different calculations.
Check the sample behind every statistic. If a nominal fifteen-year study has only eleven usable entry and exit pairs, the reported percentage should be interpreted using eleven observations. Small samples produce coarse percentages and fragile conclusions. Software should help expose these limits; a precise-looking decimal does not create more evidence.
Evaluate cost through the tasks you actually complete
List the markets and functions you require before looking at subscription prices. Then check current access terms, including any data restrictions that affect your intended research. Do not assign value to every feature equally. A specialized function you never use cannot compensate for a missing contract pair that you examine each week.
During a trial or demonstration, complete the same task twice. The first attempt includes learning the interface; the second reveals how repeatable the workflow becomes. Note unclear labels, lost settings and the number of steps required to reach individual historical observations. Use these observations to judge usability instead of treating the first page-load time as a complete performance test.
Finish with a practical comparison: required coverage, understandable calculations, repeatable workflow and current cost. If one of these remains unknown, resolve it before deciding that a platform fits. For a focused comparison with an established seasonal research product, continue to the SeasonAlgo alternative guide and use identical inputs in both systems.
Continue your research
Inspect the evidence behind a spread idea
Explore the available markets, compare seasonal windows and review historical outcomes.
Open FuturesSpreadFutures trading involves substantial risk. Educational examples are hypothetical. Historical patterns and backtests do not guarantee future results. Check current market coverage and access terms in the product.
Research content version 2026.09.29.1