Seasonality analyzer
Compare exact dated Corn calendar spreads across multiple historical lookbacks.
Use dated-contract tools to analyze calendar spreads, compare recurring seasonal windows, inspect individual historical years and understand the current futures curve.
Futures spread research is easier when the full workflow is connected. A chart alone shows the relationship, but a useful research toolkit should also expose the historical seasons, the current curve, the exact contract pair and the risk behind the average.

Compare exact dated Corn calendar spreads across multiple historical lookbacks.
Rank recurring setups and open the underlying evidence.
Inspect contango, backwardation and mixed term structure.
A strong-looking seasonal setup can be misleading if the current curve regime is unusual. A compelling forward-curve relationship can also be weak historically. The tools are designed to move between those views rather than treating them as separate research silos.
Select exact Corn contracts, compare historical windows, inspect every season and connect the result with the current curve.
Start AnalyzingThe analyzer works with explicit delivery months because spread behavior depends on the exact legs. A continuous generic futures chart can hide the month-to-month economics a calendar spread is intended to measure.
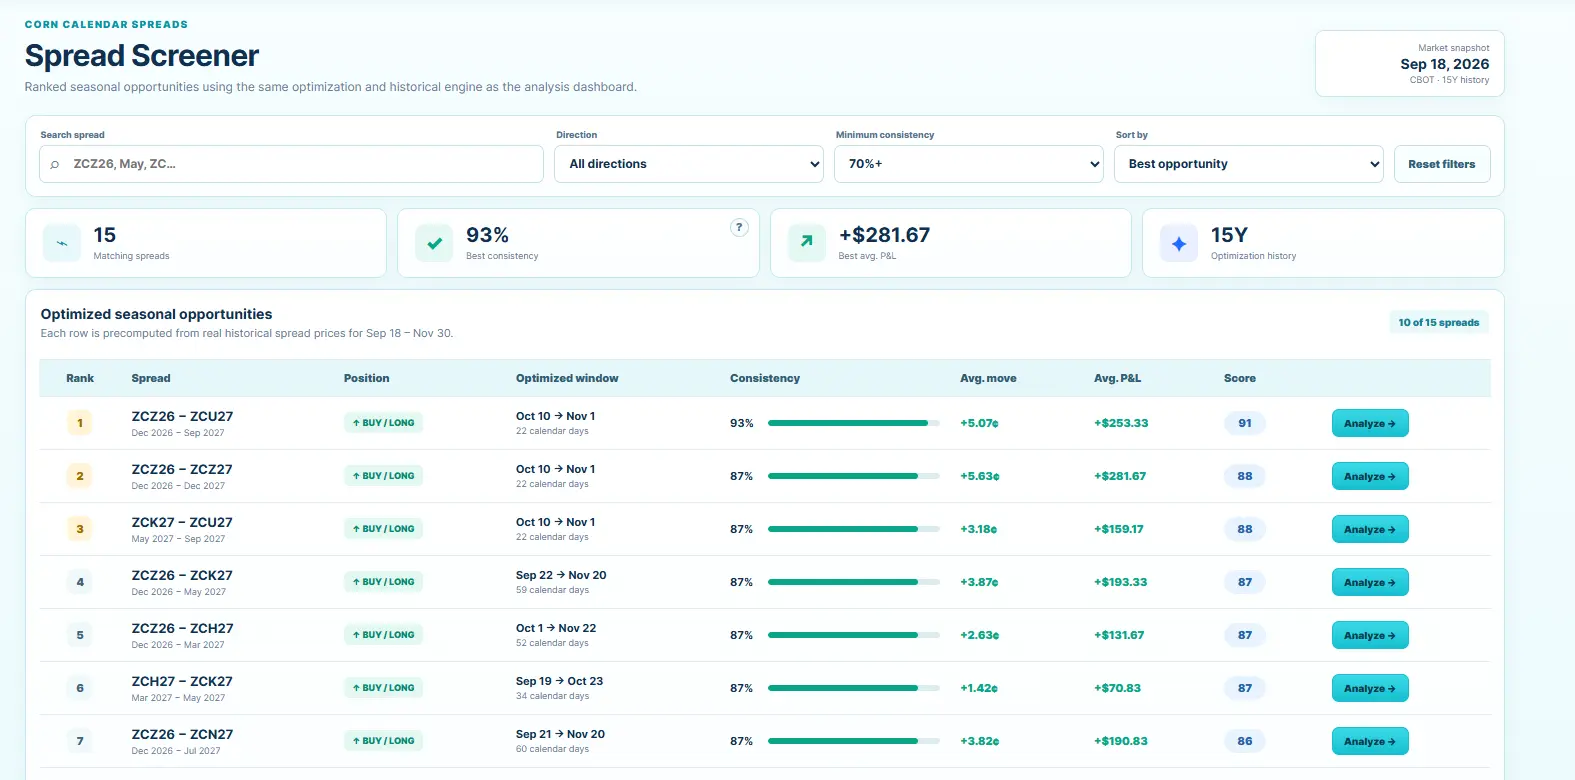
The screener is for discovery, not proof. After finding a high-ranked setup, open the full analysis and inspect individual years, losing seasons, drawdowns and sensitivity across history windows.

The current live product focuses on Corn calendar spreads. Educational content elsewhere on the site discusses other commodity markets, but those pages do not imply live tool coverage for those markets.
The strongest workflow is sequential. Use the screener to discover candidate spreads, the analyzer to inspect the historical pattern, the forward curve to understand current structure, and the year-by-year results to challenge the headline statistics.
This prevents a common mistake: treating one output as the whole answer. A high consistency score can still hide poor downside, and an attractive curve relationship can still have weak historical seasonality.
| Tool | Main question |
|---|---|
| Screener | Which spreads deserve attention? |
| Analyzer | How did this exact spread behave historically? |
| Backtester | What happened during this defined window? |
| Forward Curve | What is the current term structure? |
Do not jump directly from a ranked result to a trade. Do not hide losing years. Do not compare generic continuous futures when the strategy depends on dated contracts. And do not assume the current market resembles the historical average without checking the curve regime.
The purpose of the toolkit is to make those checks fast enough that they become part of the routine rather than an afterthought.
The site provides direct access to the research interface and current Corn spread tools. Pricing and access terms can change, so use the live product pages for the current offering.
The current live research workflow is focused on Corn dated futures contracts and Corn calendar spreads.
No. It provides historical seasonality, spread relationships, rankings and curve context for research. Historical patterns are not forecasts.
Calendar spreads depend on exact delivery months. Dated contracts preserve the specific relationship being researched.
Use the live analyzer, screener and forward-curve tools to research Corn calendar spreads.
Open Futures SpreadFutures trading involves substantial risk. Futures Spread is a research and education tool. Historical patterns, rankings and backtests do not guarantee future results.