The purpose of a screener is discovery. It can rank spread setups by consistency, historical return, timing and a composite score so you can focus attention on the strongest candidates.
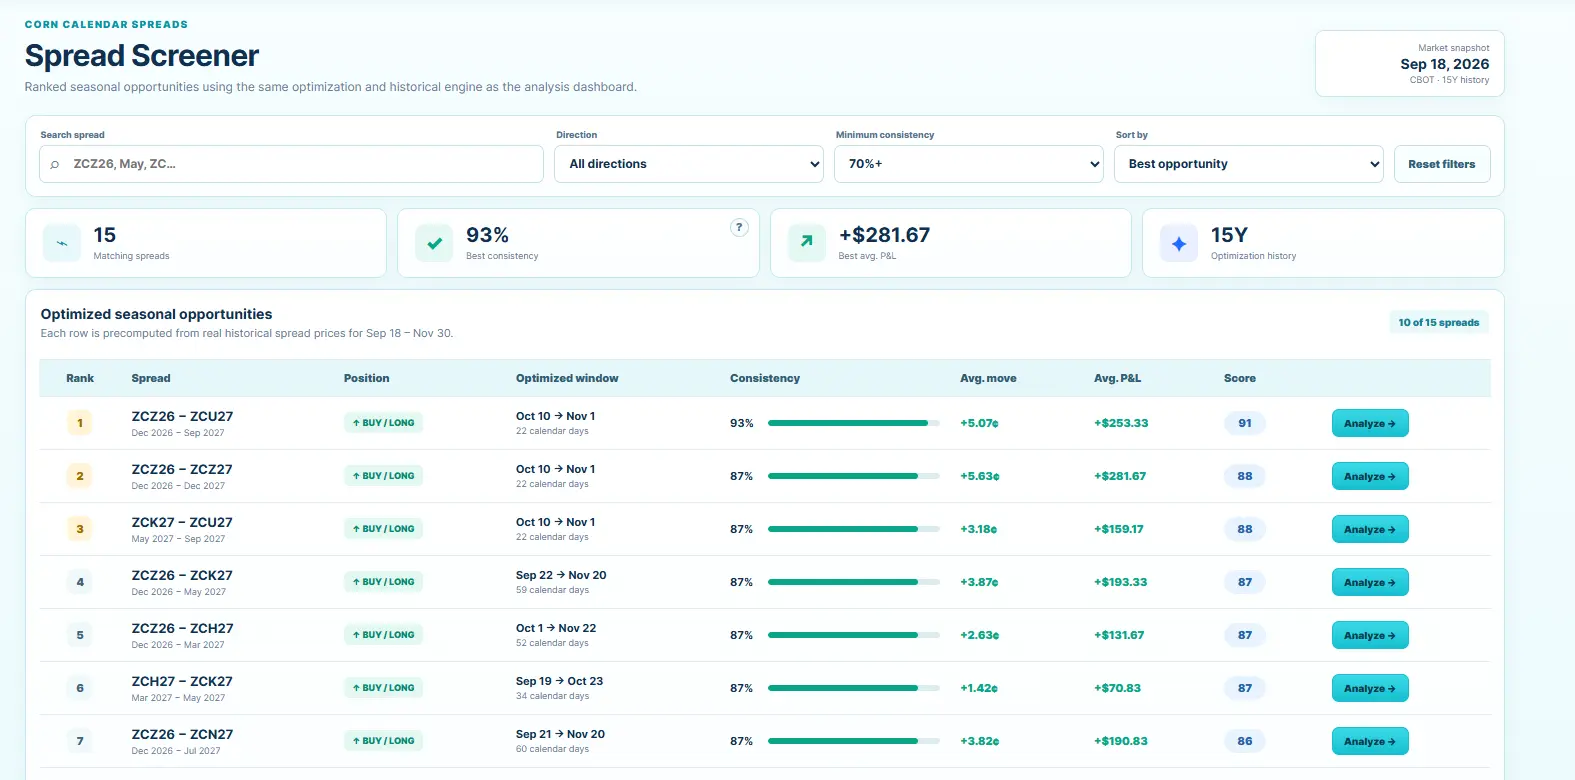
Metrics a screener can use
- Historical consistency or win rate.
- Average spread move.
- Average hypothetical P&L.
- Holding period.
- Stability across lookbacks.
- Composite opportunity score.
Why the top-ranked result is not automatically the best trade
A ranking compresses multiple statistics into one ordering. It cannot replace inspection of losing years, drawdowns, liquidity and current curve regime.
Use the live Futures Spread research workflow
Select exact Corn contracts, compare historical windows, inspect every season and connect the result with the current curve.
Start AnalyzingFrom screener to analyzer
After selecting a candidate, open the full Seasonality workspace. Review the exact contract pair, individual historical years and the current forward curve before drawing conclusions.

Avoid chasing score alone
Any ranking model reflects design choices. Treat the score as a research filter rather than a prediction of future success.
How ranking systems can mislead
A screener must decide how to weight consistency, average move, holding period and sample size. Change those weights and the ranking changes. That is not a flaw—it is a reminder that the score is a research filter, not an objective truth.
Use ranking to narrow the universe, then inspect the full historical record. The most important question is whether the underlying evidence still looks attractive after you remove the score from view.
What to inspect after clicking Analyze
- Exact delivery-month pair.
- Entry and exit window.
- Individual winning and losing years.
- Average versus median behavior.
- Worst historical move.
- Current forward-curve regime.
This handoff from screener to analyzer is where discovery becomes validation.
Explore this tools cluster
Frequently asked questions
Is Futures Spread free to use?
The site provides direct access to the research interface and current Corn spread tools. Pricing and access terms can change, so use the live product pages for the current offering.
Which market does the live analyzer support?
The current live research workflow is focused on Corn dated futures contracts and Corn calendar spreads.
Does the tool give trading signals?
No. It provides historical seasonality, spread relationships, rankings and curve context for research. Historical patterns are not forecasts.
Why use dated contracts instead of a continuous futures chart?
Calendar spreads depend on exact delivery months. Dated contracts preserve the specific relationship being researched.
Move from a spread idea to transparent historical evidence
Use the live analyzer, screener and forward-curve tools to research Corn calendar spreads.
Open Futures SpreadFutures trading involves substantial risk. Futures Spread is a research and education tool. Historical patterns, rankings and backtests do not guarantee future results.