Free futures spread research is most useful when it exposes enough information to validate the idea yourself. A chart without the underlying years can be visually persuasive but difficult to audit.

What transparent analysis should include
- Exact dated contract symbols.
- Clear spread formula and leg direction.
- Several history windows.
- Individual historical seasons.
- Winning and losing years.
- Current forward-curve context.
Use the live Futures Spread research workflow
Select exact Corn contracts, compare historical windows, inspect every season and connect the result with the current curve.
Start AnalyzingWhy transparency matters
A 73% historical win rate can mean very different things depending on the size of wins and losses. The year-by-year table reveals whether the summary is representative.
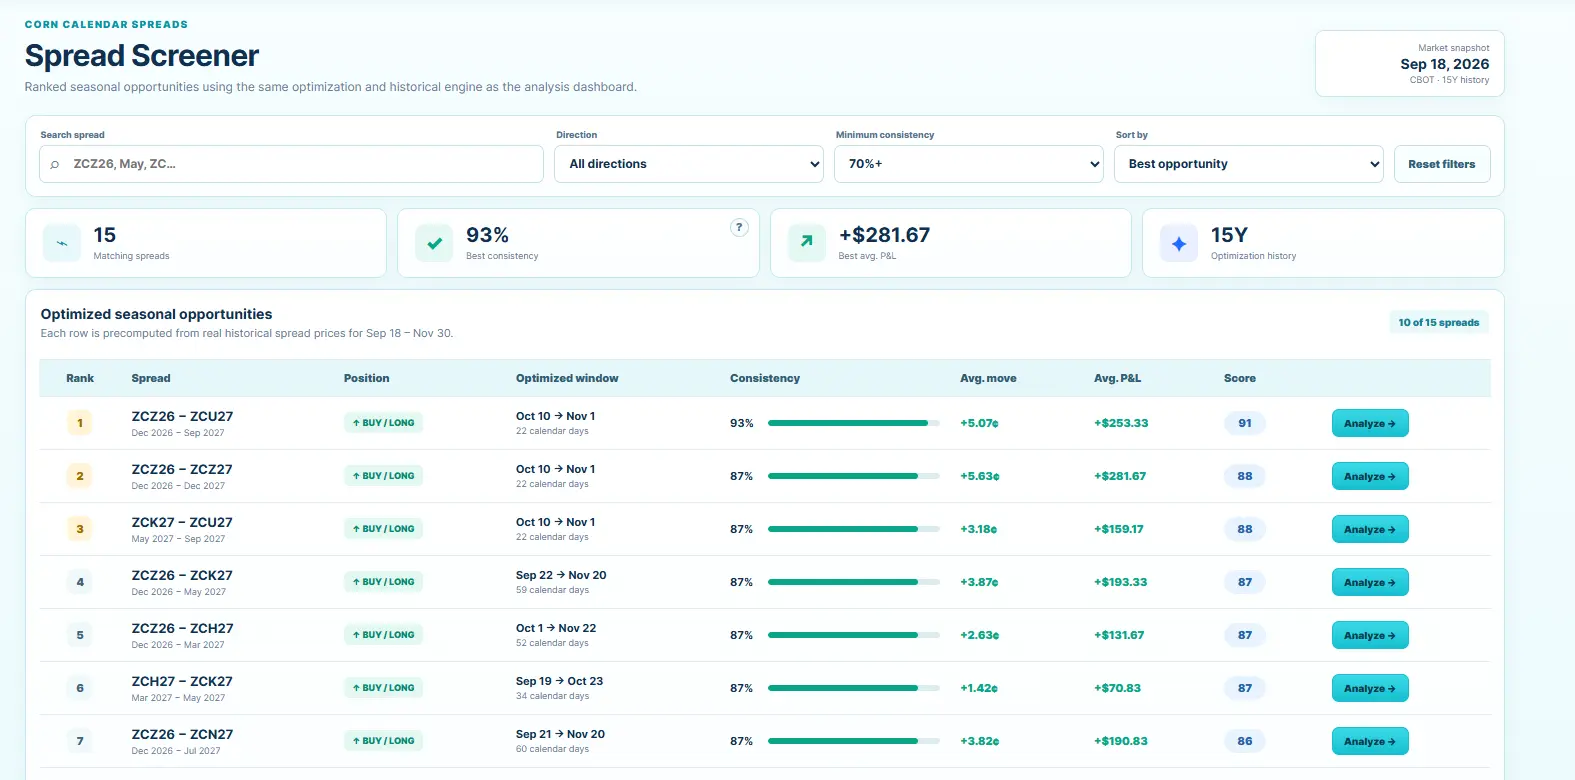
Current live coverage
Futures Spread currently provides live research workflows for Corn calendar spreads. Other commodity pages on the site are educational until live product coverage expands.

What “free analysis” should not hide
A useful free tool should not require you to trust an unexplained score. At minimum, you should be able to see the exact contracts, the date window, historical outcomes and the basis for the headline statistics.
Transparency matters because seasonality can look stronger than it is when the losing years or outliers are hidden.
How to evaluate a free tool critically
| Feature | Why it matters |
|---|---|
| Dated contracts | Preserves the real spread structure |
| Individual years | Exposes outliers and losses |
| Multiple lookbacks | Shows regime sensitivity |
| Forward curve | Adds current context |
| Clear methodology | Makes results reproducible |
A polished chart is useful, but the underlying evidence is what makes the analysis trustworthy.
Explore this tools cluster
Frequently asked questions
Is Futures Spread free to use?
The site provides direct access to the research interface and current Corn spread tools. Pricing and access terms can change, so use the live product pages for the current offering.
Which market does the live analyzer support?
The current live research workflow is focused on Corn dated futures contracts and Corn calendar spreads.
Does the tool give trading signals?
No. It provides historical seasonality, spread relationships, rankings and curve context for research. Historical patterns are not forecasts.
Why use dated contracts instead of a continuous futures chart?
Calendar spreads depend on exact delivery months. Dated contracts preserve the specific relationship being researched.
Move from a spread idea to transparent historical evidence
Use the live analyzer, screener and forward-curve tools to research Corn calendar spreads.
Open Futures SpreadFutures trading involves substantial risk. Futures Spread is a research and education tool. Historical patterns, rankings and backtests do not guarantee future results.