Contract relationships
Compare exact delivery months instead of looking only at the outright commodity price.
A futures spread compares the price of two related futures contracts instead of focusing on the outright price of one contract. The goal is to study the relationship between delivery months, seasonality, storage economics and the structure of the futures curve.
Many traders first encounter futures through directional positions: buy a contract if you expect the commodity to rise, or sell it if you expect the commodity to fall. Spread trading looks at the market differently. Rather than asking only where the commodity price is going, a spread trader asks how one delivery month may move relative to another.

That distinction matters because different futures months can respond differently to harvest cycles, inventory changes, weather, storage costs and commercial demand. A calendar spread can therefore reveal information that an outright chart may hide.
Compare exact delivery months instead of looking only at the outright commodity price.
Study recurring historical windows across multiple lookbacks and individual years.
Place the spread inside the current term structure and identify contango or backwardation.
A futures spread is a position built from two futures contracts on the same underlying commodity but with different expiration months. One contract is bought and another is sold. The value of the spread is the price difference between those two contracts.
Assume December corn trades at 480 cents and May corn trades at 495 cents. A December–May spread is calculated from the difference between those two prices. If the relationship between the contracts changes, the spread changes even if both contracts move in the same general direction.
This is why spread analysis is fundamentally relative. A trader can be correct about the relationship between two contracts even when the outright commodity moves sharply.
Choose the contract months and compare historical spread behavior instead of relying on a generic market rule.
Analyze a Futures SpreadCalendar spreads are often used to study recurring behavior in commodity markets. Agricultural products, energy contracts and some financial futures can exhibit repeatable timing because supply and demand conditions change through the year.
The shape of the futures curve is one of the most useful pieces of context for spread traders. In a contango structure, deferred contracts generally trade above nearby contracts. In backwardation, nearby contracts generally trade above deferred contracts.
| Market structure | Typical curve shape | What it can reflect |
|---|---|---|
| Contango | Later contracts priced above nearby contracts | Storage, financing and ample near-term supply |
| Backwardation | Nearby contracts priced above later contracts | Tight immediate supply or strong near-term demand |
| Flat curve | Small differences between months | Balanced expectations or transition between regimes |
These descriptions are not trading signals by themselves. The important question is how the current curve compares with historical behavior for the same contracts and the same time of year.
A spread may behave differently in March than it does in September because the underlying commercial forces are different. That is why historical spread research should align the same contract relationship across multiple years rather than simply averaging unrelated observations.
A useful seasonal study typically looks at the same spread structure over several historical years and compares average movement, median movement, win rate, best and worst outcomes, and the consistency of the pattern through different lookback windows.
A practical workflow is to begin with the contract relationship, then add historical and structural context.
Futures symbols include both month and year. A December 2026 versus May 2027 spread is not interchangeable with a December 2025 versus May 2026 spread. Contract identity matters.
Use the same price convention across the full historical sample. Mixing settlement prices, intraday prices or differently adjusted data can distort the result.
A five-year pattern may reflect a recent market regime. A fifteen- or twenty-year sample may show whether the behavior is more persistent. Comparing multiple windows is often more informative than choosing one.
Look at the current relationship between nearby and deferred contracts. The same seasonal setup can behave differently when the market is in strong contango versus strong backwardation.
Average performance alone is not enough. Examine losing years, dispersion, drawdowns and the size of historical adverse moves.
A good spread idea should survive several layers of checking. The goal is not to find a visually attractive average line; it is to determine whether the relationship has enough historical consistency and current-market context to deserve attention.
Begin with the actual month and year of both legs. A December–May relationship can behave differently across crop years and market regimes, so vague labels are not enough.
Before looking at historical seasonality, inspect where the contracts sit on the forward curve. A historically familiar window can behave very differently when nearby supply is exceptionally tight or abundant.
Shorter lookbacks can highlight recent structural changes, while longer windows can reveal whether the behavior persisted through multiple cycles. Differences between them are useful information rather than a problem to hide.
An average can look smooth even when the underlying outcomes are scattered. Strong research checks how many years followed the pattern, how large the losing years were and whether one or two outliers dominate the result.
Seasonality should be tested over a clearly defined entry and exit window. Changing the dates after seeing the result introduces hindsight and makes the study less reliable.
| Question | Outright futures | Calendar spread |
|---|---|---|
| Main focus | Direction of one contract | Relationship between two contracts |
| Primary drivers | Commodity price direction | Relative supply, demand, carry and timing |
| Seasonality | Can matter | Often central to the analysis |
| Curve structure | Secondary context | Core part of the setup |
| Risk profile | Direct exposure to price moves | Exposure to changes in the contract relationship |
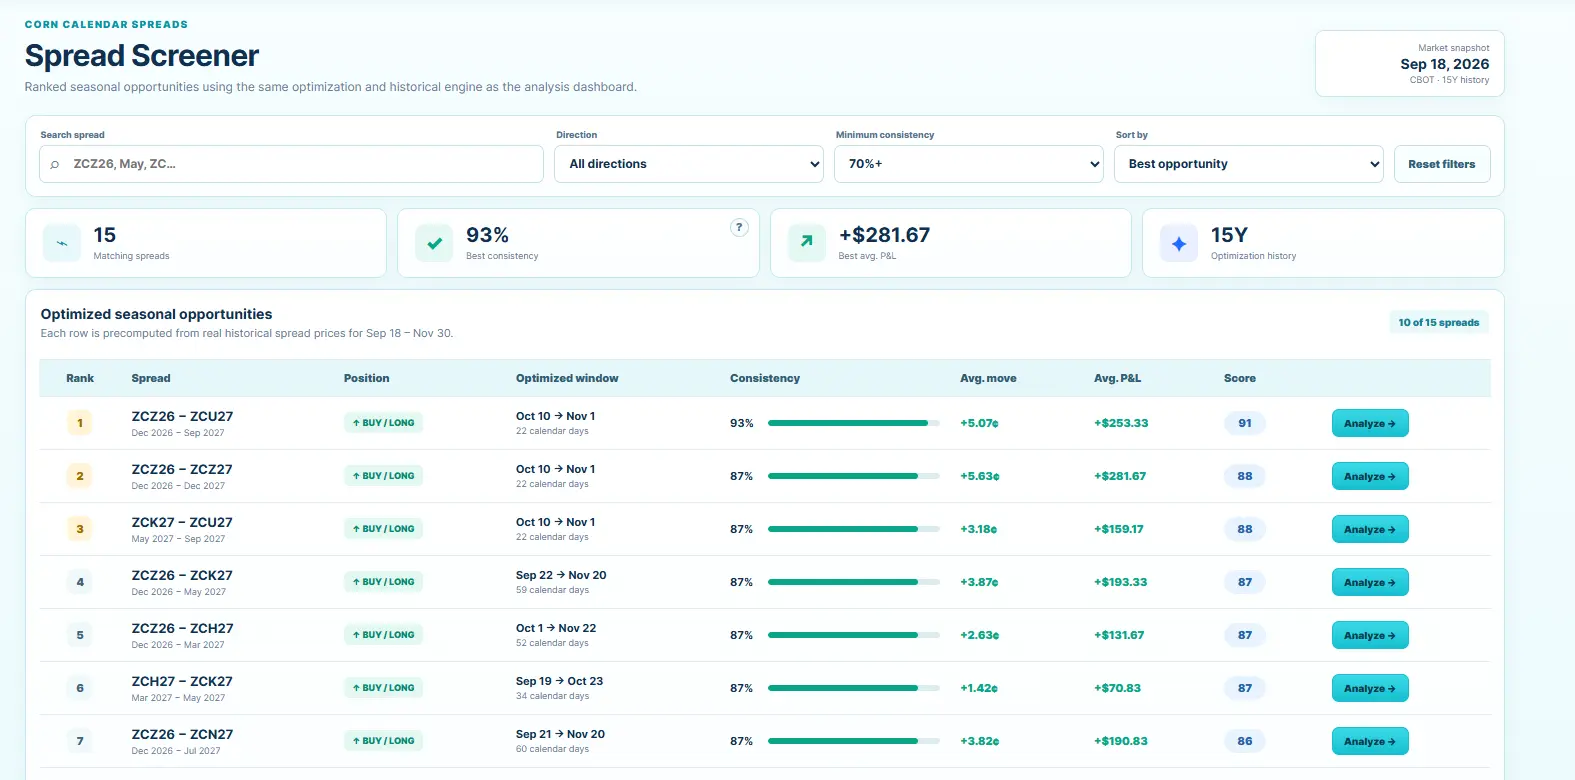
Spread analysis can be useful to several kinds of market participants, even when they have very different objectives.
Use recurring production and demand cycles as a starting point, then test whether the relationship actually appeared across historical years.
Track how nearby and deferred contracts react to inventory, storage and supply changes.
Study relative-value opportunities while measuring drawdowns and historical dispersion rather than relying only on directional views.
The tool is not designed to tell a user what to trade. It is designed to make the historical relationship easier to inspect and compare.
Spread trading has a long history of seasonal rules of thumb. Some may have a real economic foundation, while others may have weakened as production, storage and market participation changed. The only reliable way to evaluate a seasonal claim is to measure it.
That is the purpose of Futures Spread: select contracts, compare recurring historical windows, inspect individual years and place the result in the context of the current futures curve.
A futures spread is a relative-value position built from two related futures contracts. Calendar spreads usually compare different delivery months of the same underlying market.
No. Two legs can offset some broad directional exposure, but the relationship between the contracts can still move sharply and liquidity or regime changes can increase risk.
Some commodity relationships are influenced by recurring production, inventory, storage and demand cycles. Historical seasonality provides context, not a prediction.
Look beyond the average. Compare individual years, multiple lookback windows, drawdowns, consistency and the current futures-curve regime.

Use the Futures Spread analyzer to compare contract months, historical seasonal behavior and the structure behind the spread.
Open Futures Spread AnalyzerFutures trading involves substantial risk and is not suitable for every investor. Historical patterns do not guarantee future results. This article is for educational and research purposes only and is not investment advice.