A standard calendar spread compares two delivery months. Butterfly and condor structures combine several calendar relationships to isolate how the middle of the futures curve is priced relative to surrounding expirations.
What is a futures butterfly?
A common futures butterfly uses three delivery months with weights such as +1 / -2 / +1. Conceptually, it compares the middle contract with the two surrounding contracts rather than taking a simple view on one calendar gap.
Buy March, sell two May, buy July. The exact exchange convention and ratio should always be verified for the market being traded.
What is a futures condor?
A condor generally uses four delivery months. It can be viewed as a combination of calendar spreads that compares one section of the curve with another. The structure can reduce sensitivity to a broad parallel move while retaining exposure to changes in curve shape.
Why traders study multi-leg structures
- To isolate curvature rather than outright direction.
- To compare relative richness or cheapness across adjacent months.
- To study recurring seasonal changes in one segment of the curve.
- To reduce some exposure to a broad parallel shift in futures prices.
Butterfly vs calendar spread
| Feature | Calendar spread | Butterfly |
|---|---|---|
| Typical legs | 2 | 3 |
| Main focus | Gap between two months | Curvature around a middle month |
| Calculation | A − B | Often A − 2B + C |
| Complexity | Lower | Higher |
Why ratios matter
With more than two legs, the weights are part of the instrument definition. A 1:-2:1 butterfly is not the same exposure as simply adding three contract prices. Intercommodity structures can require additional multipliers to account for different contract sizes.
Execution and liquidity risk
A multi-leg relationship can look stable in historical end-of-day data but still be difficult to execute if one leg is illiquid. Some exchanges list implied or native spread instruments, while other combinations may require legging. Research should therefore distinguish theoretical history from practical execution.
Seasonality in butterflies and condors
Curve shape can change around recurring inventory, harvest or demand cycles. A multi-leg seasonal study should align the same month structure across history and check whether the pattern persists across individual years rather than relying only on an average line.
How this fits into Futures Spread research
Two-leg calendar spreads are the foundation. Once the exact contract mapping, historical alignment and P&L conventions are stable, the same research principles can be extended to three- and four-leg curve structures.
Start with the underlying calendar relationships
Analyze the component delivery-month relationships first, then use them to understand the shape of the broader futures curve.
Open Forward CurveRelated futures spread guides
Frequently asked questions
How many legs are in a futures butterfly?
A common butterfly uses three delivery months, often with a 1:-2:1 weighting, although exact conventions can vary.
How many legs are in a futures condor?
A condor generally uses four delivery months and combines multiple calendar relationships.
What does a butterfly measure?
It is commonly used to study curvature: how the middle contract is priced relative to surrounding expirations.
Are multi-leg spreads lower risk?
They can reduce some forms of broad directional exposure, but they still carry curve, liquidity, execution and regime risk.
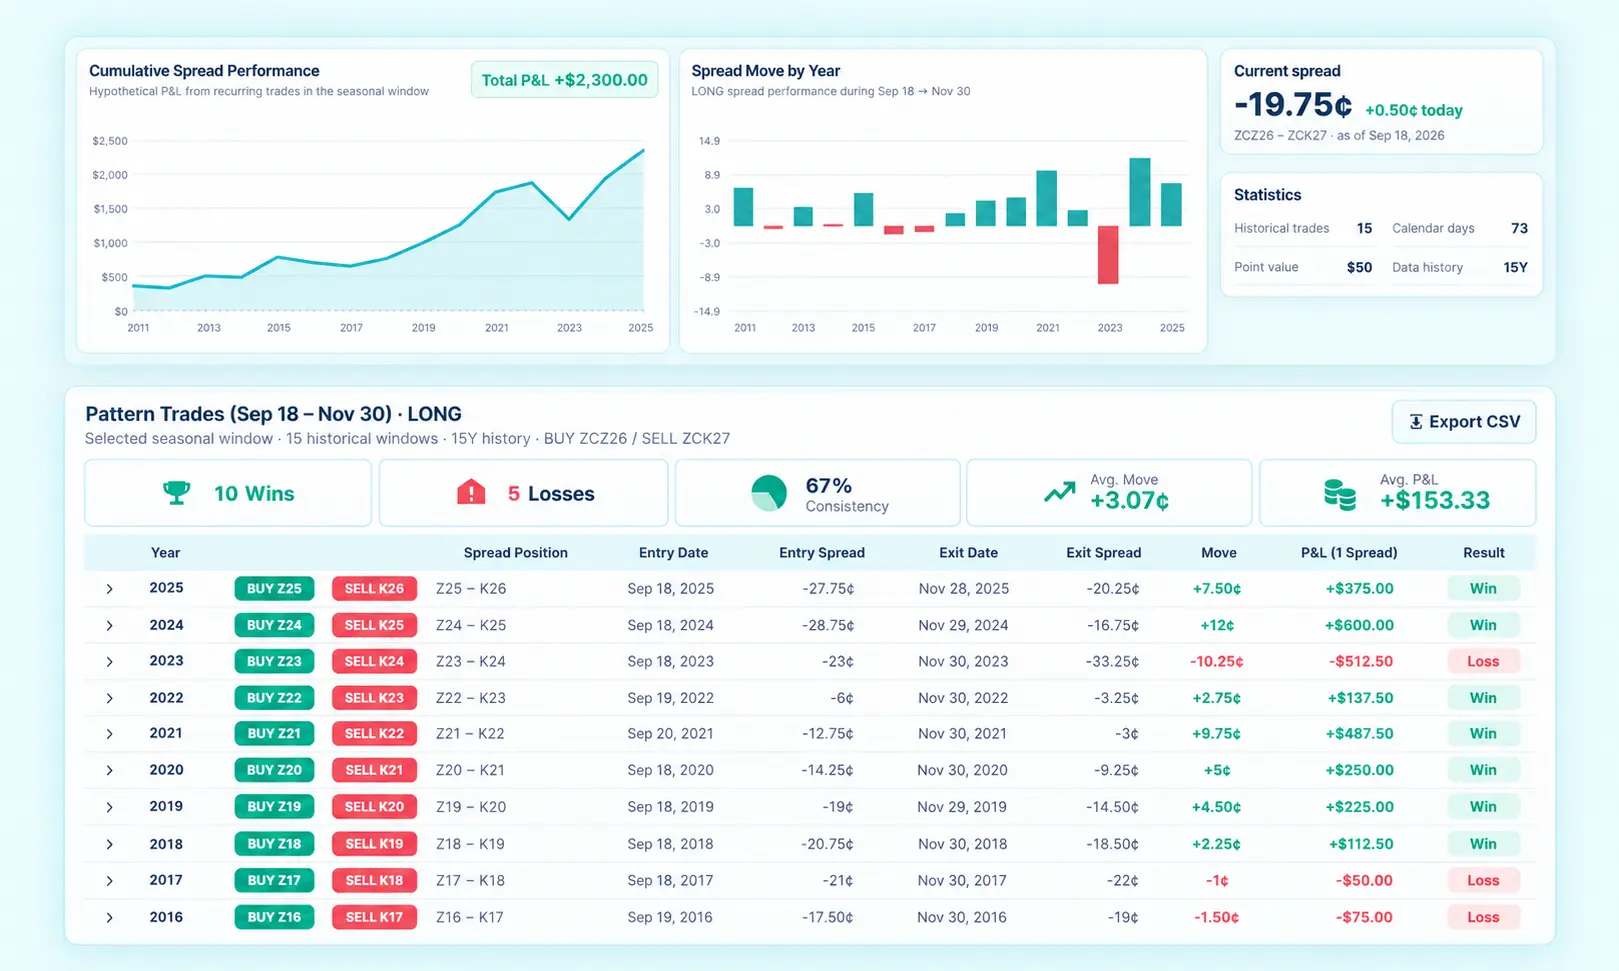
Research the relationship with historical data
Use exact delivery months, multiple lookbacks and current forward-curve context instead of relying on a generic chart.
Open Futures Spread AnalyzerFutures trading involves substantial risk. Historical patterns do not guarantee future results. This material is for education and research only and is not investment advice.