One of the most common sources of confusion in calendar-spread trading is direction. A trader can be long a spread while being long one futures contract and short another. The result depends on which contract is defined as the first leg and how the spread is calculated.
Start by defining the spread
Assume the chart is defined as December minus May. A long-spread position benefits when December strengthens relative to May, causing December minus May to rise. A short-spread position benefits when the relationship falls.
The spread moves from -20 to -10. It is still negative, but it increased by 10 points. Under a December-minus-May convention, that is an upward spread move.
Both contracts can rise while the spread falls
If December rises by 5 points but May rises by 9, December has underperformed May by 4 points. The outright commodity moved higher, but the December-minus-May spread moved lower.
| Leg | Start | End | Move |
|---|---|---|---|
| December | 500 | 505 | +5 |
| May | 520 | 529 | +9 |
| Dec − May | -20 | -24 | -4 |
Both contracts can fall while the spread rises
The opposite is also possible. If December falls less than May, the December-minus-May relationship can rise even while the commodity is declining outright. This is why spread analysis should not be interpreted as a simple bullish or bearish view on the commodity.
Long leg and long spread are not the same phrase
The long leg is the futures contract that is bought. A long spread describes the direction of the combined relationship under the chosen calculation convention. Keeping these terms separate prevents chart and P&L errors.
Why the platform should flip short-trade performance
If a historical study is displayed from the trader's P&L perspective, a short spread should show gains when the raw spread falls. The raw price series and the strategy-performance series are therefore related but not identical views.
How to read a spread chart correctly
- Confirm which contract is subtracted from which.
- Separate spread level from spread change.
- Check whether the chart shows raw price or trade P&L.
- Confirm whether the tested strategy is long or short.
- Keep the convention unchanged across all historical years.
Direction and seasonality
A recurring seasonal pattern may be upward or downward depending on the leg order. Reversing the order does not create a new economic relationship; it simply mirrors the series. What matters is maintaining one convention so historical comparisons and P&L remain interpretable.
Compare raw spread movement and strategy performance
Use the same leg order across the chart, historical trades and cumulative results so a long or short setup is represented consistently.
Analyze Spread DirectionRelated futures spread guides
Frequently asked questions
What does it mean to be long a futures spread?
Under a defined spread formula, a long-spread position benefits when the calculated relationship rises.
Can both futures legs rise while a spread loses value?
Yes. If the short-side contract rises more than the long-side contract, the relationship can move against the spread even though both outright prices rise.
Does a negative spread mean a short position?
No. A negative number describes the spread level under the chosen subtraction order. Position direction is a separate concept.
Why does reversing the leg order flip the chart?
Because B minus A is the negative of A minus B. The economic relationship is the same, but the displayed sign and direction are reversed.
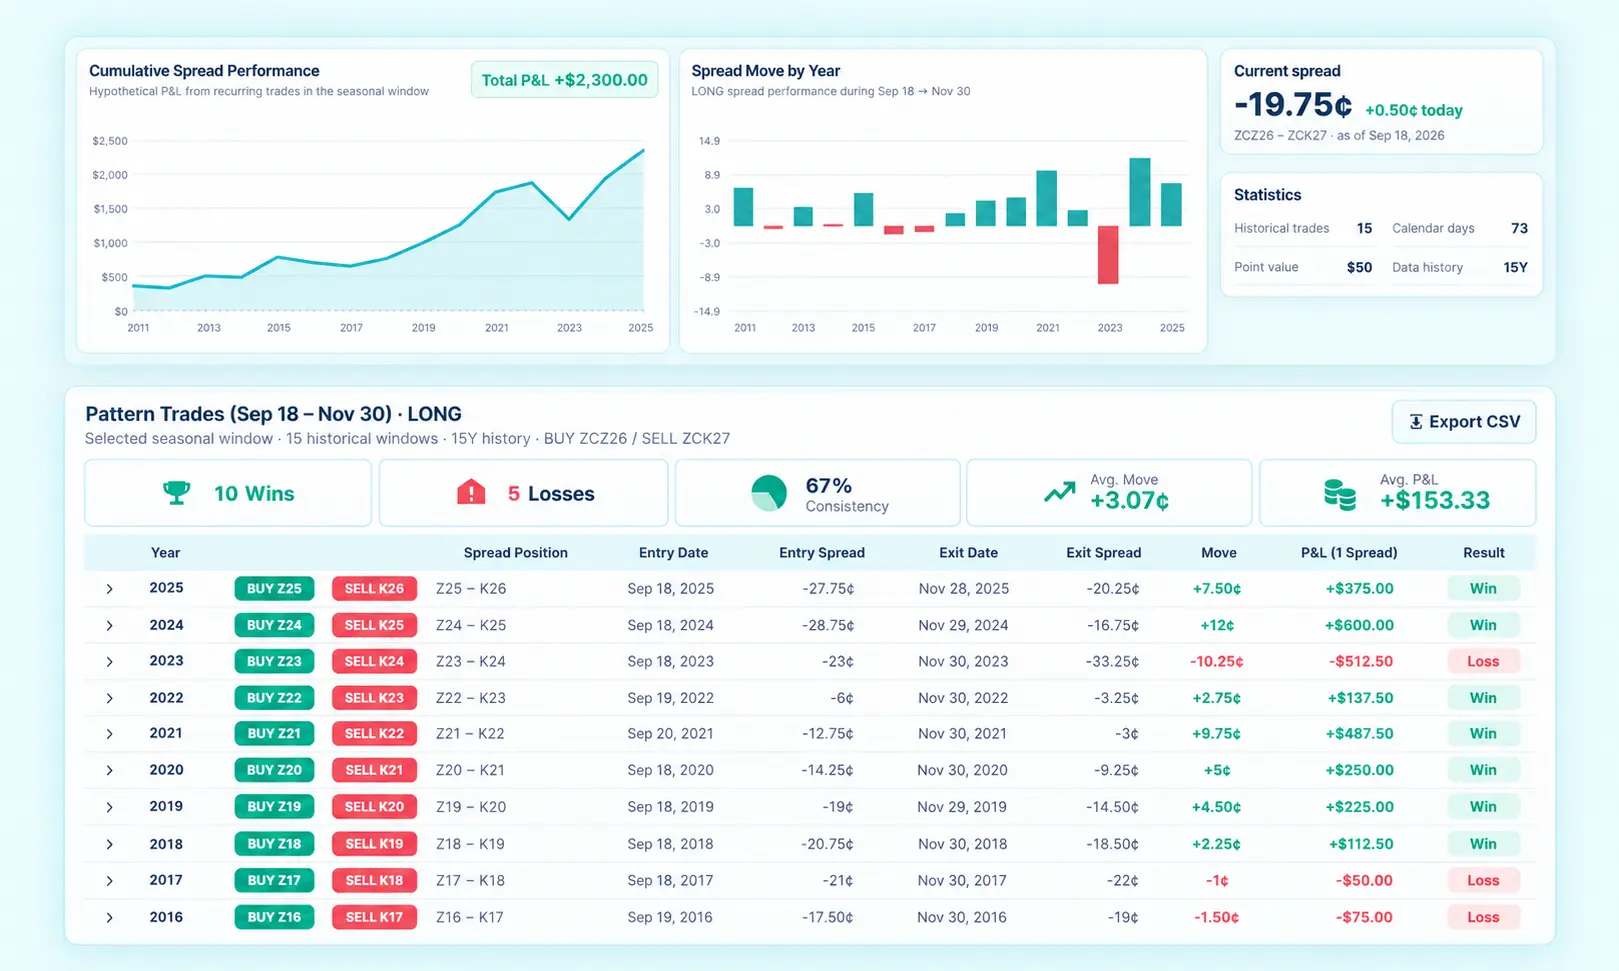
Research the relationship with historical data
Use exact delivery months, multiple lookbacks and current forward-curve context instead of relying on a generic chart.
Open Futures Spread AnalyzerFutures trading involves substantial risk. Historical patterns do not guarantee future results. This material is for education and research only and is not investment advice.