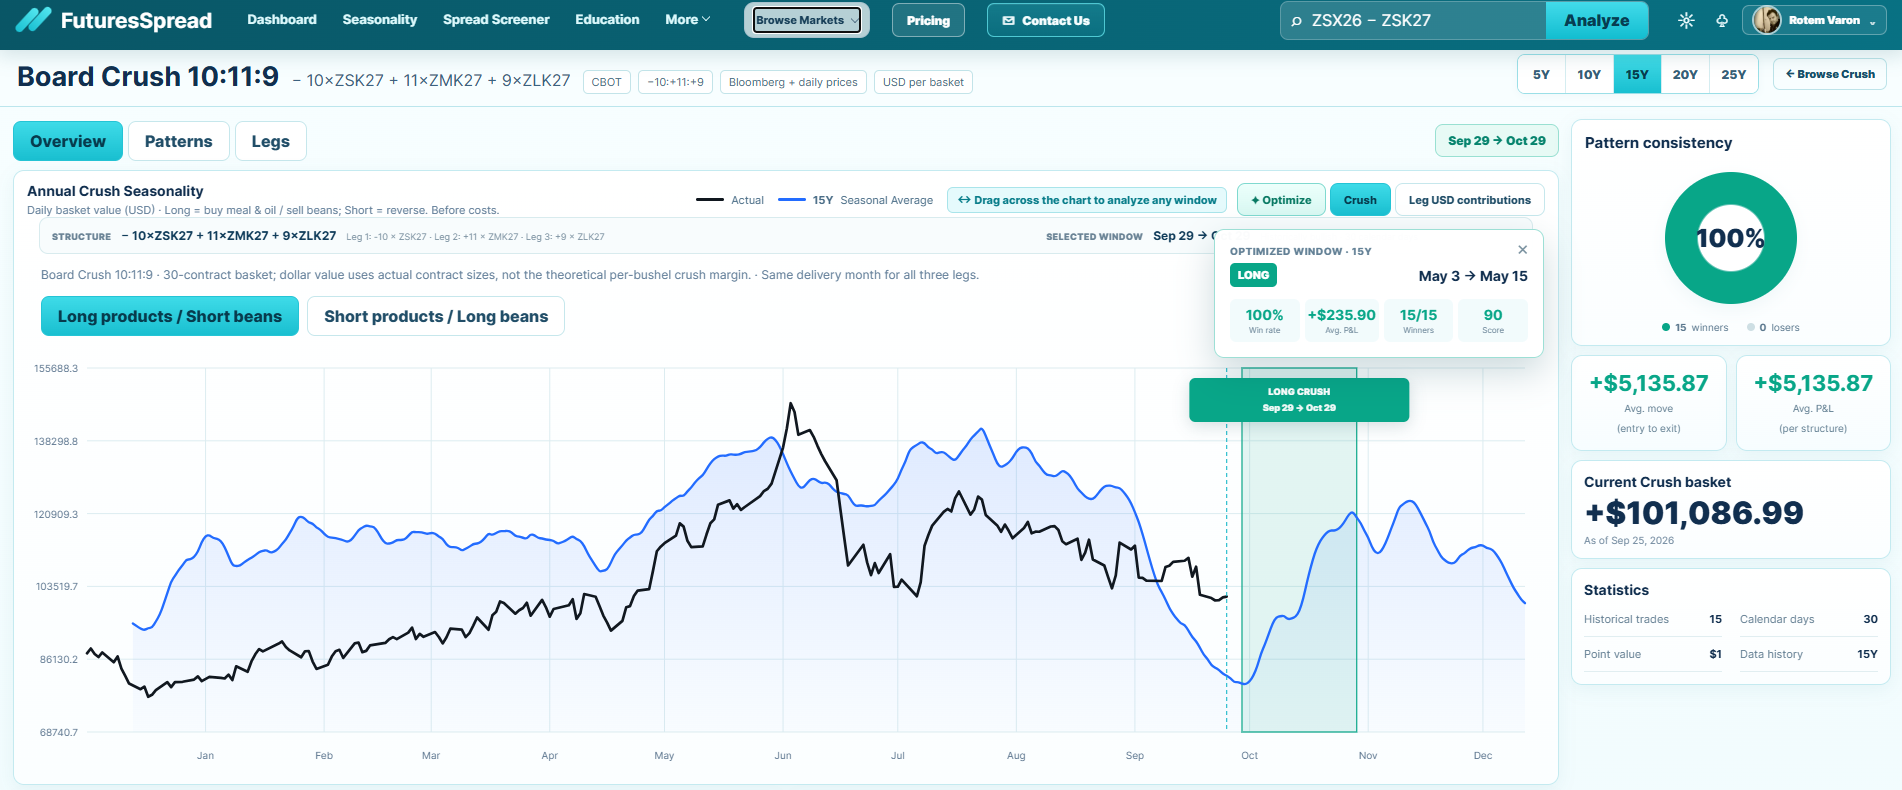
Ratio and residuals
The board ratio approximates yields. Oil exposure, extraction rates and basis can leave an imperfect hedge.
The crush spread connects three futures markets through one processing relationship. Learn the unit conversions, the exchange-traded ratio and the risks that a historical chart cannot remove.
Product screenshot from September 2026. Figures reflect a selected historical window and are not a forecast.
A soybean crush spread compares the value of soybean meal and soybean oil with the cost of the soybeans used to produce them. Processors buy beans and sell the products. In futures, buying the crush (also called the reverse crush) buys meal and oil futures and sells soybean futures; selling the crush sells the products and buys beans. It is an intercommodity spread, so all three markets and their contract specifications matter.
A widely used illustrative yield is approximately 44 pounds of meal and 11 pounds of oil from one 60-pound bushel of soybeans. Convert each product quote into dollars per bushel before subtracting the bean cost. Meal is quoted in dollars per short ton (2,000 pounds); oil in cents per pound; beans in dollars per bushel.
(Meal $/short ton × 0.022) + (Oil cents/lb × 0.11) − Soybeans $/bushelIf meal is $350/short ton, oil is 45¢/lb and beans are $12/bushel: meal contributes $7.70/bushel (350 × 0.022), oil contributes $4.95/bushel (45 × 0.11), and the illustrative gross crush margin is $0.65/bushel. This is a price relationship, not a processor's net profit or a trade's realized P&L.
Actual extraction yields, processing costs, freight, basis, quality and contract timing can change realized economics. Keep the quote units visible when comparing screens: 45¢/lb in the formula is the number 45, whereas $0.45/lb would require a different multiplier.
One contract of each market is easy to chart, but equal contract counts do not represent the same physical throughput. A standard soybean futures contract is 5,000 bushels; meal is 100 short tons; oil is 60,000 pounds. The commonly cited 10:11:9 board crush approximates the product quantities from 50,000 bushels of beans: short 10 bean contracts, long 11 meal contracts and long 9 oil contracts for a long crush. Reverse all legs for a short crush.
| Leg | Contract unit | Long crush direction | 10:11:9 quantity |
|---|---|---|---|
| Soybeans · ZS | 5,000 bushels | Sell | 10 contracts · 50,000 bushels |
| Soybean meal · ZM | 100 short tons | Buy | 11 contracts · 1,100 short tons |
| Soybean oil · ZL | 60,000 pounds | Buy | 9 contracts · 540,000 pounds |
The theoretical yield from 50,000 bushels is 1,100 short tons of meal and 550,000 pounds of oil. Nine oil contracts cover 540,000 pounds, so the board ratio is a tradable approximation, with residual exposure. A 1:1:1 chart is a different structure; label it explicitly and calculate its P&L from each leg's contract multiplier. Never apply the per-bushel formula to a 1:1:1 contract basket as though their notionals matched.
Crop arrivals, processing demand, meal feed demand and oil demand can shift the relationship through the year. To inspect a seasonal claim, compare the same dated contracts and leg ratios over multiple historical years. Review individual yearly paths, the number of usable observations, the average and the worst years. A smooth average can hide unstable outcomes.
For every proposed entry and exit window, check whether all three legs have contemporaneous settlement prices on both dates. Keep the chosen direction and ratio fixed when calculating historical moves, and turn the move into basket P&L using the relevant contract sizes. Treat any optimized window as a research lead: it may reflect choices made after seeing the history, and the future can differ.
See the cumulative path and year-by-year results for the selected historical window. Open the live analysis to change the contracts, dates and direction yourself.
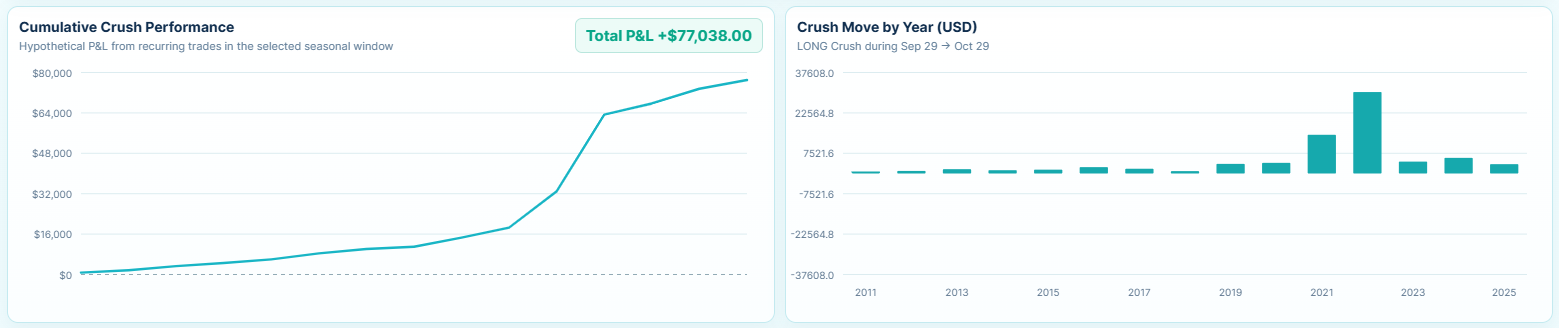
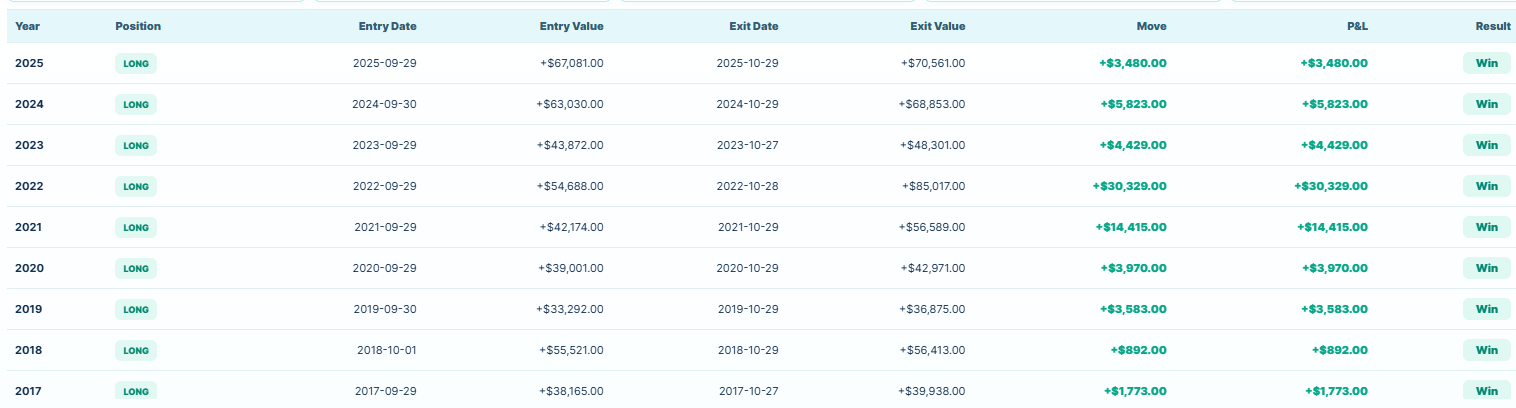
These screenshots show historical hypothetical results for a specific selection. They exclude trading costs and do not predict future returns.
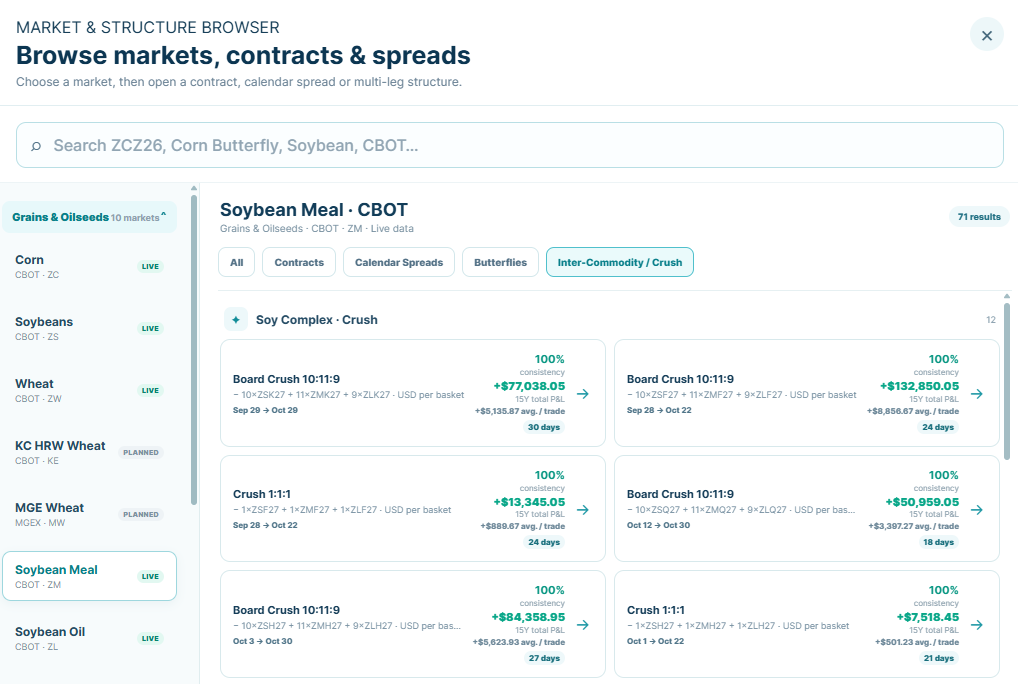
Browse available dated contracts and crush structures in Futures Spread. Confirm the displayed ratio, data coverage and analysis window before comparing results.
Browse soybean markets →The board ratio approximates yields. Oil exposure, extraction rates and basis can leave an imperfect hedge.
Each leg can have a different delivery month. Liquidity, expiration and roll timing change the position.
Exchange and broker margin requirements vary. Spreads may receive offsets, but losses and variation margin still require cash.
A quoted gross crush value omits commissions, bid–ask spread, slippage, financing, processing costs and taxes. Check the current exchange and broker rules for the exact contracts and account before placing an order; no static margin estimate is reliable for every date and portfolio.
CME soybean, soybean meal and soybean oil futures use the roots ZS, ZM and ZL respectively. A complete contract also has a delivery-month code and year; verify each listed month before comparing legs.
No. The crush combines different products—beans, meal and oil. A soybean calendar spread compares two delivery months of soybean futures.
No. It approximates standard yields with whole futures contracts and leaves residual oil exposure. Actual processing yields and cash prices can differ.
No. The quoted spread is a snapshot of futures price relationships. A trade's result depends on its entry and exit, position size, costs and how the legs are executed.
Compare this three-market structure with soybean calendar spreads, then review how seasonal spread research works.
CME Group: Soybean Crush Spreads — exchange contract sizes, yield convention and the board crush relationship.
Open the market browser to inspect the soybean complex and available structures.
Browse MarketsEducational material only, not investment advice. Futures trading involves substantial risk; historical patterns do not guarantee future results. Prices in the worked example are hypothetical.