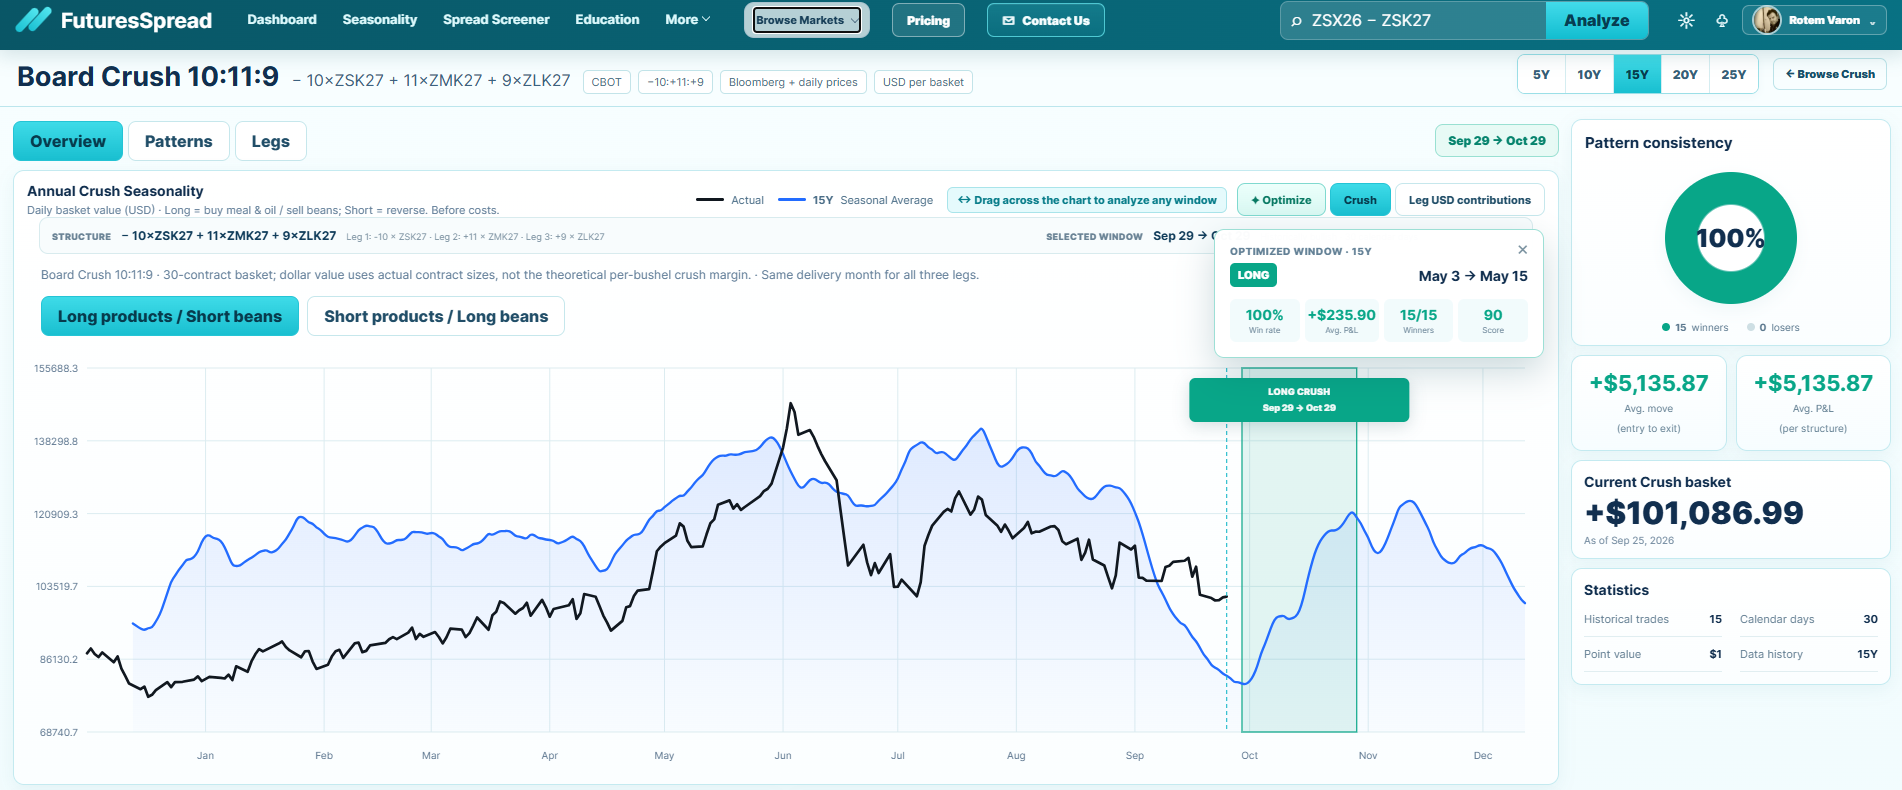
Before interpreting a crush chart, read its title and structure strip. A board crush labeled −10 × ZS + 11 × ZM + 9 × ZL tracks a long products/short beans basket. Its price axis is USD per basket. An equal-weight 1:1:1 crush has a different scale and exposure; the vertical axis is not interchangeable.
Actual line, seasonal line and today
The actual line shows the basket value calculated from observed prices for the current season to the latest available date. The seasonal line summarizes a chosen lookback of comparable historical structures. A vertical today marker separates available current observations from the rest of the annual axis. Prices to the right of today on a seasonal line represent past-year patterns projected on the calendar—not prices that have already traded this year.
Where the display uses normalization, the seasonal curve is meant to compare shape. Its absolute height need not be the arithmetic average of historical basket values. To quantify a potential move, use the same structure's historical entry and exit values by year and confirm the USD unit.
What the highlighted window means
The shaded region marks selected calendar entry and exit dates. It is an analysis selection, not an order. A green label may indicate that the chosen historical direction was favorable in the selected sample; that is a description of the backtest. Dragging the window or running optimization changes which hypothetical historical trades are measured.
Basket level versus trade P&L
If a long-products basket reads $101,000 today, that is its current weighted value at the shown prices. It is not $101,000 of profit. A hypothetical trade entered when that same basket was $98,000 and exited at $101,000 would have a gross move of +$3,000 per basket, before costs. A short-products position would have the opposite gross result for those dates. This example is for unit interpretation only.
The leg contribution view can help explain the change: each soybean, meal and oil move is converted to USD using its contract size and weight. A rising oil contribution can offset a declining meal contribution. Always check all three legs before attributing a basket move to one commodity.
Use yearly results to test the picture
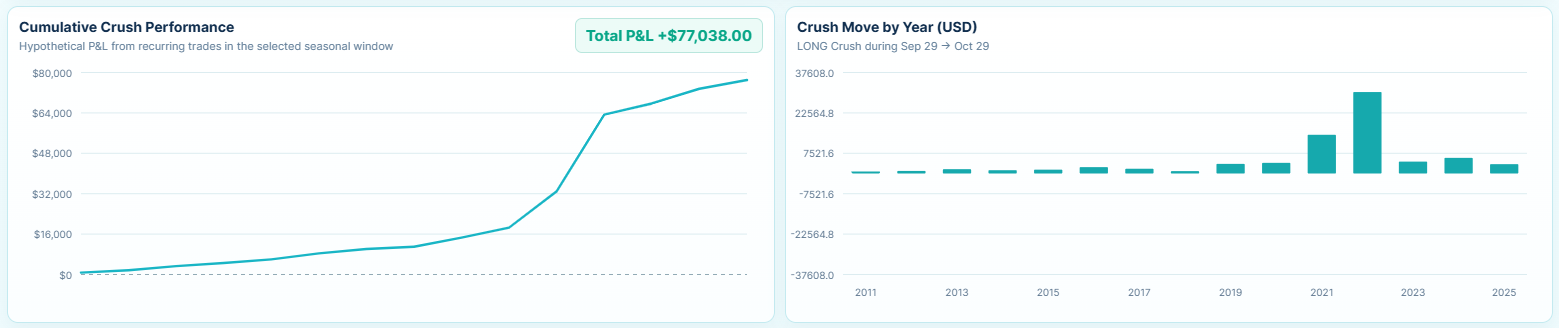
Win rate counts winning historical years among the years with valid entry and exit values. Average move is the mean of those historical moves. Cumulative performance adds hypothetical yearly outcomes for a repeated window; it is not an account equity curve with commissions, slippage, margin funding, position sizing changes or intra-day fills.
Read the chart with the exact ratio visible
Choose a board or 1:1:1 structure in the market browser, then review its legs and yearly data.
Open Crush Charts →Frequently asked questions
Is the seasonal line a forecast?
No. It summarizes historical behavior under the selected lookback and display method.
What does USD per basket mean?
The three leg prices are converted to dollars using their contract multipliers and selected quantities, then combined with their signs.
Why can the chart look good while a year lost money?
Averages can smooth away individual losing years and large adverse moves within the window.
Analyze a dated crush structure
Check the selected legs, ratio and history in the product before drawing any conclusion.
Browse Crush StructuresEducational material only, not investment advice. Historical results are hypothetical and do not guarantee future performance. Unless stated otherwise, worked prices are illustrative and trading costs are excluded.