Soybean crushing economics can shift with harvest supply, processing demand, meal feed consumption and oil demand. A recurring seasonal window may emerge in historical prices, but it must be tested on the same three-leg structure across comparable years. One attractive averaged curve alone is not evidence of a reliable future trade.
Keep the basket comparable
First specify the soybean, meal and oil contract delivery months, the year offsets and the leg ratio. November soybeans against December meal and oil are not interchangeable with a same-month three-leg basket. If a position crosses a calendar year, map each historical soybean and product leg with the same relative year offset. Do not splice a continuous nearby series into a dated-contract study without clearly stating a different methodology.
On every historical date, all three legs must have usable prices. Compare the entry and exit on the same dates for all legs. Missing prices, holidays and the available contract history can reduce the number of valid years. A chart label saying 15Y describes the lookback setting; inspect the actual sample used at each date and for each trade.
Read the seasonal line correctly
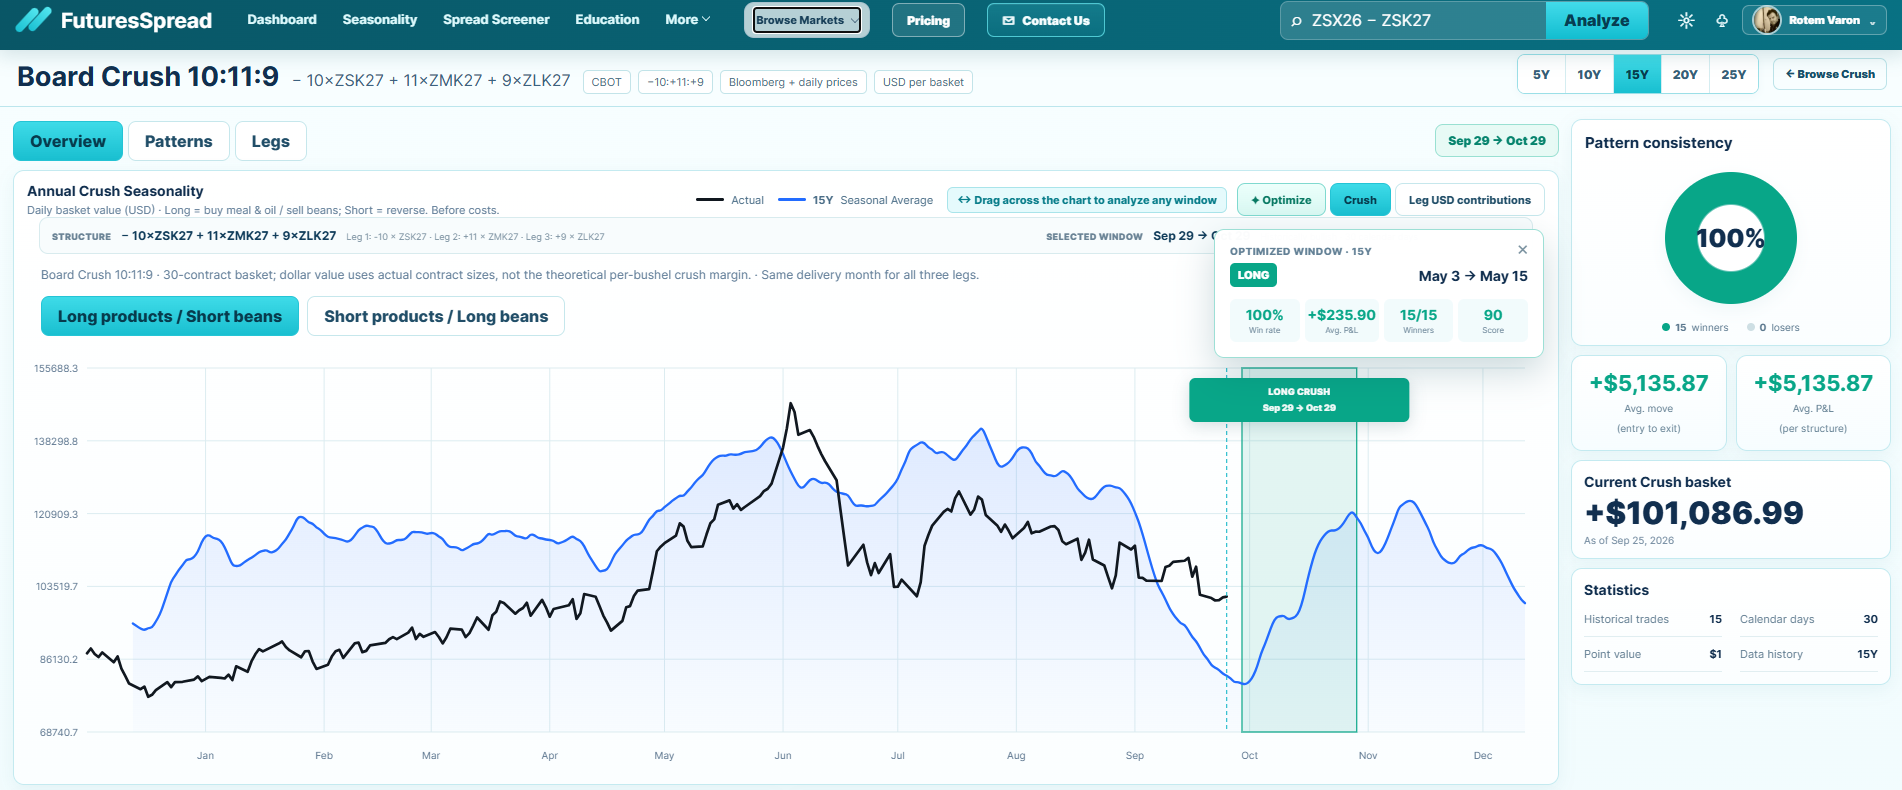
The blue seasonal line in the analyzer shows the historical tendency for the selected structure. Historical seasonal charts can normalize individual years to compare shape, then map that shape onto the current chart range. The line should not be read as a literal future dollar quote. Use the black actual line to see the current basket, the vertical today marker to separate observed prices from the rest of the seasonal year, and the highlighted rectangle to see the selected window.
Inspect every historical trade
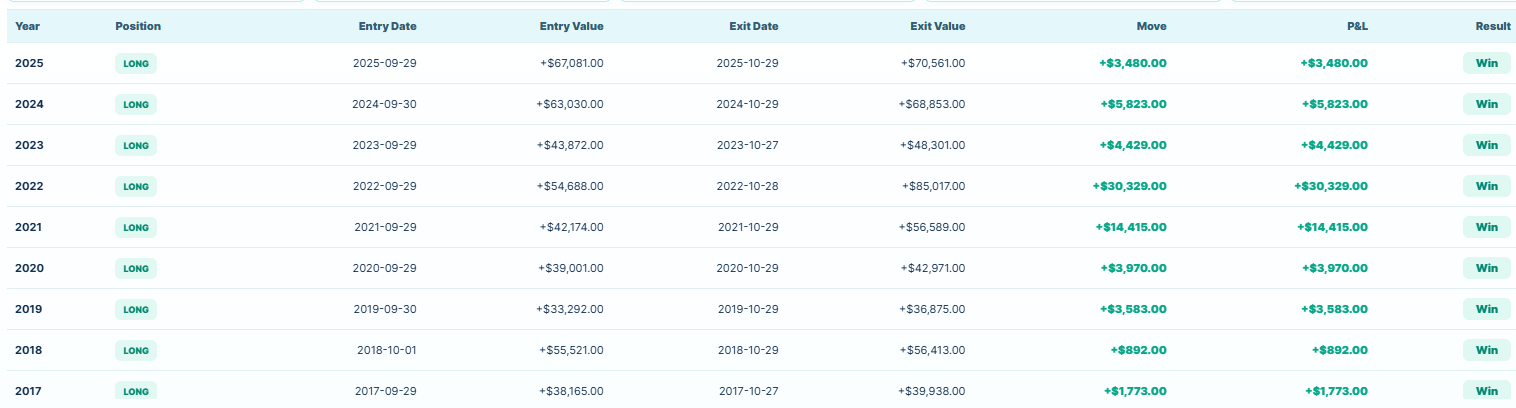
For each valid year, a hypothetical move is the exit basket value minus the entry basket value for long products/short beans. Reverse the sign for short products/long beans. Multiply only if the structure's displayed unit requires it; the current board crush basket is already expressed in USD per basket. A profit summary must be tied to a fixed direction, dates and contract weights.
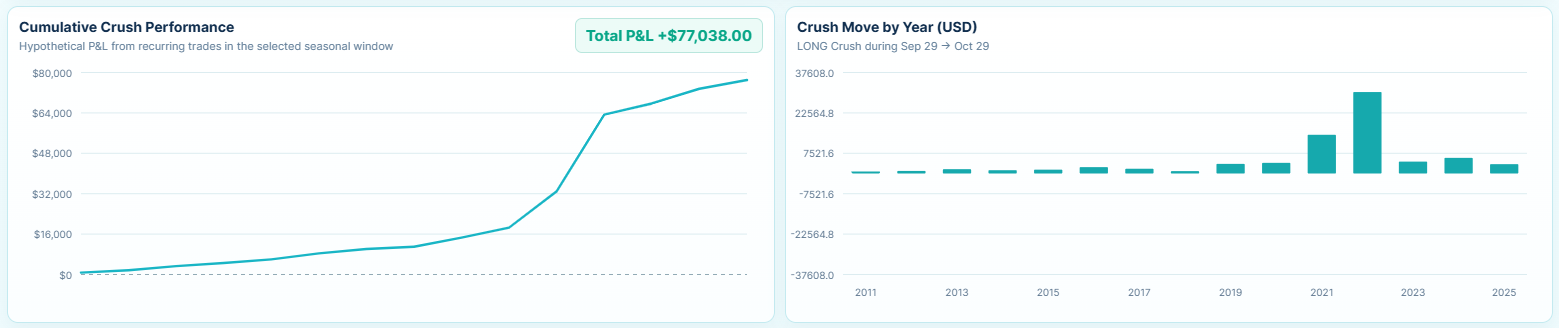
Review the yearly table alongside any win rate, average P&L and cumulative result. Look for a single dominant year, clusters of losses, large interim drawdowns and years excluded by missing data. A cumulative historical line can look compelling even if a future year behaves differently. The figures shown in product screenshots are hypothetical and before commissions or slippage.
What an optimized window can and cannot prove
An optimizer searches historical entry and exit dates for a strong combination. Because it selects the window after seeing the history, its reported statistics can overstate what a new, unseen year may deliver. A sensible review checks neighboring date windows, shorter and longer lookbacks, both trade directions, and whether results remain meaningful after estimated costs. Testing an untouched later sample is stronger evidence than repeatedly adjusting one in-sample window.
Change the dates yourself
Browse the available crush structures, drag the chart window and compare the individual years.
Explore Crush Seasonality →Further reading
Start with CME Group's board crush overview for the exchange relationship among the legs.
Frequently asked questions
Does a 15-year chart mean 15 valid trades?
Not necessarily. Availability of all three dated legs and both entry and exit prices determines the valid sample.
Is a 100% historical win rate a guarantee?
No. It describes a selected historical sample and window; selection bias, changing fundamentals and future volatility remain.
Can I compare a 1:1:1 chart to a 10:11:9 chart directly?
Only after accounting for the different contract quantities and USD basket exposures.
Analyze a dated crush structure
Check the selected legs, ratio and history in the product before drawing any conclusion.
Browse Crush StructuresEducational material only, not investment advice. Historical results are hypothetical and do not guarantee future performance. Unless stated otherwise, worked prices are illustrative and trading costs are excluded.