Use the N–U–Z example to see how a butterfly isolates the shape around the new-crop hinge. This guide keeps the exchange, dated legs and historical-data boundary visible so the quoted relationship can be checked.
Write the legs in full
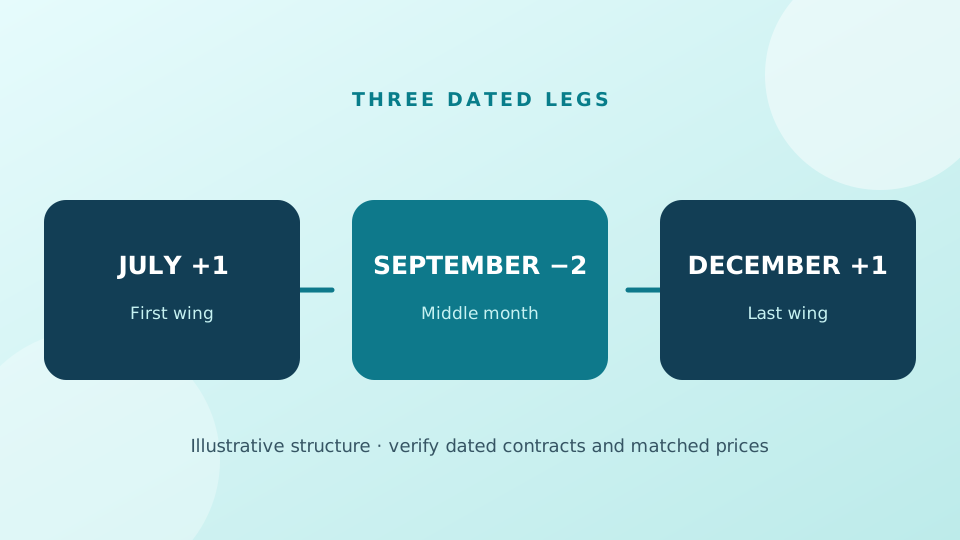
The N–U–Z Minneapolis butterfly is one July contract minus two September contracts plus one December contract of the specified years. The structure can be viewed as (July − September) minus (September − December). Because September sits in both component calendars, its price has a coefficient of minus two.
On 30 June 2025 the imported dated prices were N25 603.00 cents, U25 620.75 cents and Z25 639.00 cents. The N–U calendar was −17.75 cents; U–Z was −18.25 cents; their difference was +0.50 cent. This arithmetic checks the directly calculated 1:−2:1 result.
What a change may mean
A rise in the butterfly means the wings gained relative to twice the middle price under this sign convention. It does not mean all three outright contracts rose. The relationship can shift with new-crop expectations, nearby availability, storage and quality premiums, and a two-leg calendar may behave differently from the butterfly.
As the July contract approaches notice and expiration, a hypothetical spring-to-summer window needs an operational cutoff. A profitable backtest entry that cannot be executed or exited without delivery exposure is not a sound implementation.
Questions for the historical sample
How many years have all three prices on both selected dates? Is the typical result shared across years or driven by a few outliers? How deep was the largest adverse move between entry and exit, and what did the middle contract do? These questions matter more than a single average bar.
The site’s MGE research page allows the N–U–Z historical structure and displays each included year. It does not claim a current N26–U26–Z26 quote because the imported MGE series has no recent verified observations.
See the dated contracts behind the formula
Explore matched historical Minneapolis prices, individual years and the selected date window. The dataset has no verified current MGE spread.
Open MGE Historical Research →Primary sources
Exchange and USDA sources establish product definitions and context. Recheck the current rules and dates before using a contract.
Continue this series
Educational historical research, not investment advice. Futures and multi-leg spreads involve substantial loss, execution and delivery risk. Historical results do not guarantee future outcomes. Imported Minneapolis prices stop on 24 October 2025; current quotes and margin must be verified independently.