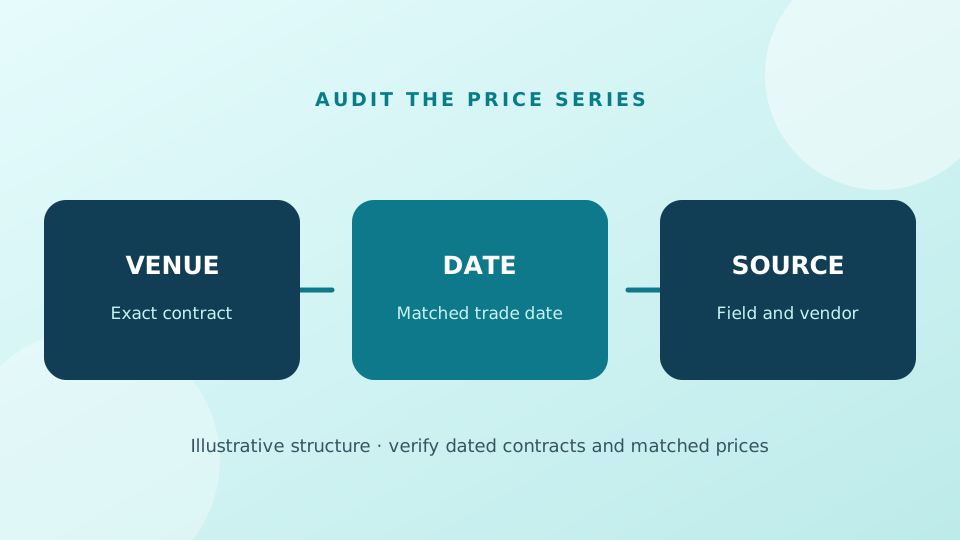
A repeatable backtest needs dated contracts, matched observations, explicit missing-data rules and an honest sample. This guide keeps the exchange, dated legs and historical-data boundary visible so the quoted relationship can be checked.
Use dated contracts
A continuous wheat future may roll between delivery months. Subtracting two continuous series can change the economic trade underneath the chart. Instead, select each actual dated leg and preserve its year offset in every historical season. December 2026 versus March 2027 maps to December y versus March y+1.
The raw structure is the weighted sum of same-date leg prices: +1/−1 for a calendar, +1/−2/+1 for a butterfly. A cross-wheat pair also needs matched delivery months, units and venue identities. Never fill an absent leg with zero or with a nearby market’s price.
Define the window before scoring
Set entry and exit dates, direction and sample length before inspecting the best years. If those dates fall on a weekend, define a transparent nearby-trading-day rule; if a required observation cannot be found, exclude that season and show the resulting count. A window with only a handful of valid years should not be described as a 15-year result.
Separate the chart’s normalized shape from P&L. Calculate each yearly trade from the raw structure price at the actual entry and exit dates, multiply the movement by the contract point value, and show gross results before commission, slippage and financing.
Make failures visible
List every included year, the percentage positive, average and median movement, the worst result and maximum adverse move during the window. Test whether small changes in dates or lookback years erase an apparent edge. Rule changes, source changes and structurally missing years need annotation.
The current MGE website view labels its archive historical only. A 2025 Last price cannot be treated as a 2026 close just because it belongs to a 2026 delivery-month contract.
See the dated contracts behind the formula
Explore matched historical Minneapolis prices, individual years and the selected date window. The dataset has no verified current MGE spread.
Open MGE Historical Research →Primary sources
Exchange and USDA sources establish product definitions and context. Recheck the current rules and dates before using a contract.
Continue this series
Educational historical research, not investment advice. Futures and multi-leg spreads involve substantial loss, execution and delivery risk. Historical results do not guarantee future outcomes. Imported Minneapolis prices stop on 24 October 2025; current quotes and margin must be verified independently.