Treat a seasonal curve as a testable historical summary, not a prediction. This guide keeps the exchange, dated legs and historical-data boundary visible so the quoted relationship can be checked.
Fix the structure before the window
First decide which dated legs you are studying: a Minneapolis calendar, a three-leg butterfly or a Minneapolis–Kansas City same-month difference. Decide whether long means first minus second, and whether the butterfly uses 1:−2:1. Only then choose a lookback and entry-to-exit window. Changing the structure after seeing results is a form of selection bias.
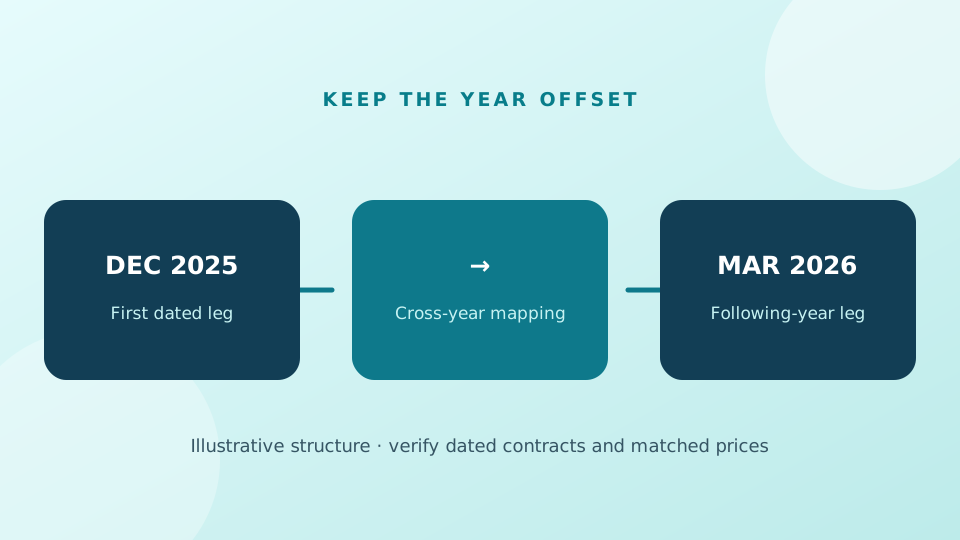
For each season, preserve the relationship between contract and crop year. A December-to-March pair crosses years; the corresponding historical pair must do the same. Use only dates on which every leg has an observation.
Compare like with like
Map calendar dates across years but retain the actual raw quoted spread for each year’s P&L. Some charts normalize each season before averaging to emphasize direction or shape. That line can make movement easier to see, yet its vertical height is not an executable price or expected gain.
Report the count of contributing seasons at each point and the years omitted for missing prices. Requiring at least a few years does not automatically make a pattern robust; examine whether the mean is driven by exceptional years and whether it survives different lookback lengths.
Ground the pattern in the crop
USDA’s weekly Crop Progress reports and monthly WASDE estimates provide independent context on crop stages, supply and use. They do not tell a trader the exact future entry date or ensure the historical window repeats. Weather, export demand, storage and policy may shift the timing.
A current seasonal chart also needs current, verified Minneapolis prices. The imported MGE history stops in October 2025, so the website currently presents only past seasons and no live MGE overlay or ranked current opportunity.
See the dated contracts behind the formula
Explore matched historical Minneapolis prices, individual years and the selected date window. The dataset has no verified current MGE spread.
Open MGE Historical Research →Primary sources
Exchange and USDA sources establish product definitions and context. Recheck the current rules and dates before using a contract.
Continue this series
Educational historical research, not investment advice. Futures and multi-leg spreads involve substantial loss, execution and delivery risk. Historical results do not guarantee future outcomes. Imported Minneapolis prices stop on 24 October 2025; current quotes and margin must be verified independently.